If you're selling on Amazon, you already know that visibility alone doesn't guarantee sales. Your product could rank on the first page, yet still underperform competitors with seemingly similar offerings. The difference? Conversion rate optimization through strategic A/B testing.
In 2026, Amazon sellers who leverage data-driven testing strategies see conversion rate improvements of 20% or more. This guide is your masterclass in modern amazon seo strategies, walking you through everything from title optimization to advanced competitor analysis. By the end, you'll have a repeatable framework for A/B testing that systematically improves your listing performance and maximizes revenue.
The Cornerstone of Amazon SEO Strategies: Why A/B Testing Matters
Amazon's A9 algorithm doesn't just reward products with high sales volume. It rewards products that convert well. When your listing converts at a higher rate, the algorithm sees this as a powerful signal that your product is relevant. This is the heart of all effective amazon seo strategies: signaling value to the A9 algorithm to earn better organic rankings, more impressions, and ultimately, more sales.
The problem? Most sellers optimize their listings based on guesswork or competitor imitation. They change their title because a competitor's title looks good. They switch images because they think lifestyle photos perform better. But without testing, they never actually know what works for their specific product and audience.
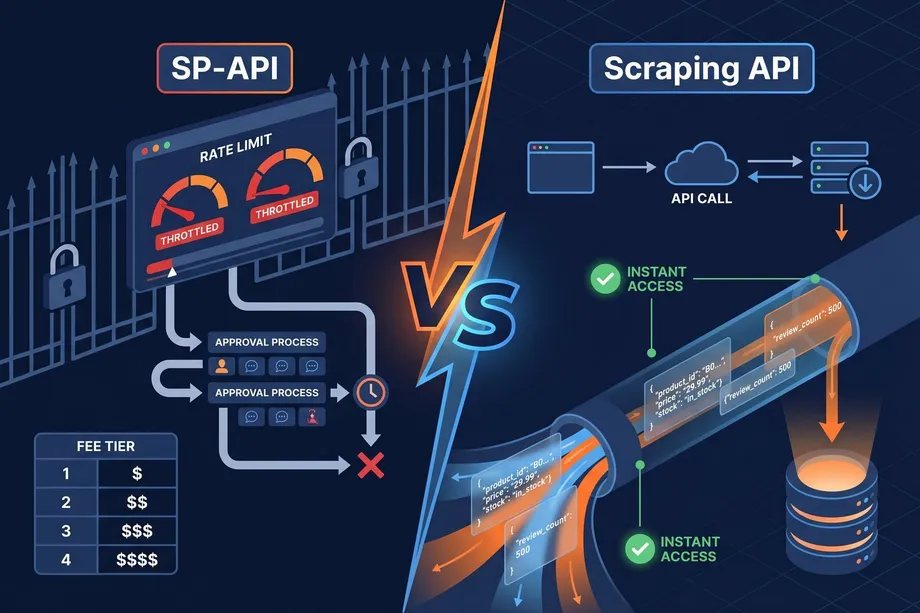
A/B testing removes the guesswork. Amazon's official "Manage Your Experiments" tool lets you test different versions of your listing content and see exactly which version drives more conversions. For operational benchmarking, many teams combine this workflow with Search Listing and Amazon product data api data. The result is a data-backed optimization strategy that works.
Understanding Amazon's Manage Your Experiments Tool
Amazon's "Manage Your Experiments" is a free, built-in A/B testing tool available to brand-registered sellers. It's designed specifically for Amazon's marketplace, which means it accounts for Amazon-specific factors like the Buy Box, search ranking signals, and conversion metrics.
What You Can Test
The tool allows you to create experiments for:
- Product Titles: Test different keyword arrangements, feature emphasis, or length variations
- Main Images: Compare white-background product shots against lifestyle images, different angles, or color variations
- Bullet Points: Test different benefit statements, feature descriptions, or formatting styles
- Product Descriptions: Experiment with length, keyword density, or benefit-focused copy
- A+ Content: Test different A+ modules, layouts, or messaging approaches
Eligibility Requirements
To run experiments, you need:
- A Professional selling account (not Individual)
- Amazon Brand Registry enrollment
- A branded product listing (unbranded or generic products don't qualify)
- Sufficient traffic to generate statistically meaningful data
Test Duration and Statistical Significance
Amazon recommends running tests for 8-10 weeks to gather enough data for statistically significant results. However, you can also use the "to significance" option, which allows Amazon's algorithm to automatically conclude the test once it has collected enough data-typically 4 weeks or more.
The key metric is statistical significance. This means the difference in performance between your two versions is unlikely to be due to random chance. Amazon displays a probability percentage showing how confident they are in the results. The higher this percentage, the more reliable your findings.
The Core Metrics: What Actually Drives Conversions
Before you start testing, you need to understand the metrics that matter. These are the KPIs that determine whether your listing converts well or underperforms.
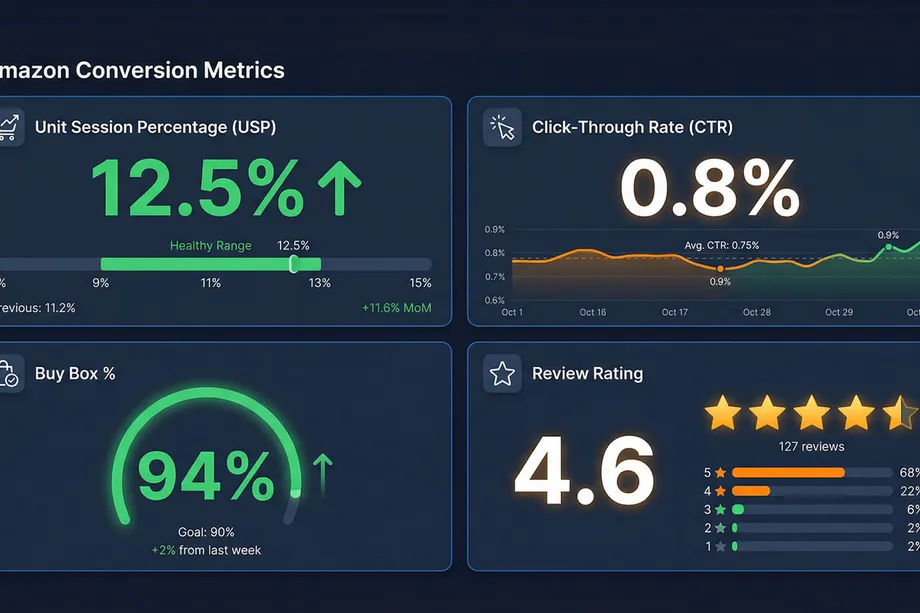
Unit Session Percentage (USP)
This is the most important metric on Amazon. It measures how many units you sell per session. The formula is simple: Units Ordered ÷ Sessions = USP.
A healthy USP ranges from 7-15% depending on your category. If your USP is declining, it's often an early warning sign that your listing needs optimization. A higher USP signals to Amazon's algorithm that your product is converting well, which can improve your ranking over time.
Click-Through Rate (CTR)
CTR measures how often shoppers click on your product when they see it in search results. Amazon doesn't display organic CTR directly, but you can infer it from your session counts and ranking position. A strong CTR (0.5% or higher for ads) indicates that your main image and title are compelling enough to stand out in crowded search results.
Buy Box Percentage
Without the Buy Box, you don't make sales-even if your listing is perfect. Buy Box percentage shows how often your offer wins the Buy Box when customers view your listing. Factors like pricing, shipping speed, and seller performance all influence this metric.
Review Rating and Count
Social proof is powerful. Products with 4.2+ stars and 50+ reviews see significantly higher conversion rates than new products with few reviews. This is why maintaining a steady review flow is critical to long-term success.
A Core Amazon SEO Strategy: Title Optimization
Your product title is one of the first things shoppers see, and it serves dual purposes: it communicates what your product is, and it tells Amazon's search algorithm what keywords your product should rank for.
The Title Optimization Formula
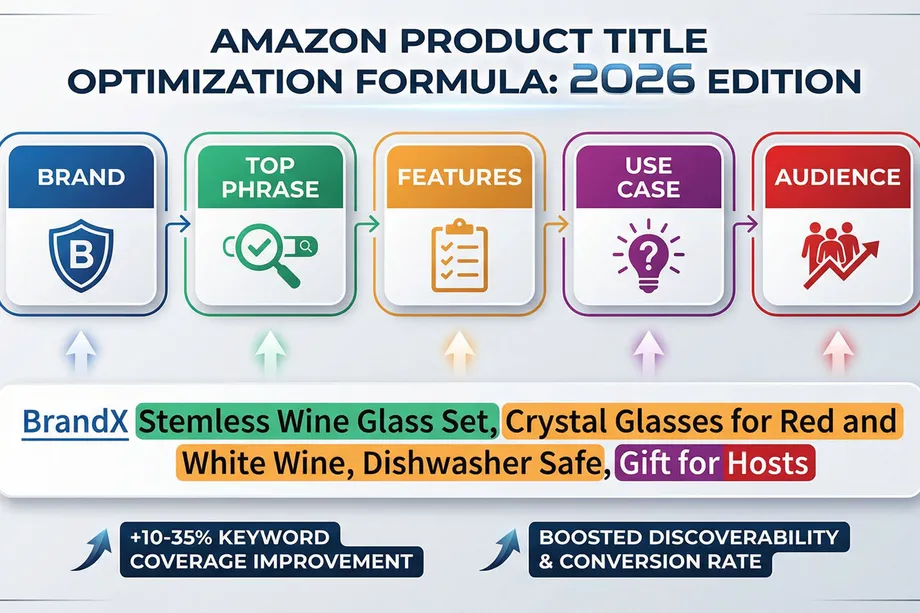
The proven formula for 2026 is: Brand + Top Phrase, Feature Group, Use Case Group, Audience/Gifting Group
Here's what each component does:
- Brand: Start with your brand name for consistency and compliance
- Top Phrase: Your highest-intent keyword phrase (e.g., "Stemless Wine Glass Set" instead of just "Wine Glass")
- Feature Group: Key features like material, size, or quantity (e.g., "Crystal, Dishwasher Safe")
- Use Case Group: How the product is used (e.g., "for Red and White Wine")
- Audience/Gifting Group: Who it's for (e.g., "Gift for Hosts")
Real-World Example
Before: "BrandX Wine Glass Set, Glasses for Wine, Wine Glass, Crystal Glasses, Gift Set"
After: "BrandX Stemless Wine Glass Set, Crystal Glasses for Red and White Wine, Dishwasher Safe, Gift for Hosts"
Results: The optimized title typically generates +10 to +35% more indexed keyword coverage, +5 to +18% more organic impressions, and +2 to +8% CTR improvement within 14-28 days.
Title Optimization Best Practices
- Avoid repetition: Don't use the same keyword multiple times. Each word should add unique value.
- Prioritize relevance over length: Use most of your character limit, but only for relevant keywords
- Front-load your top keyword: The first 40-60 characters are most important for both shoppers and the algorithm
- Keep it readable on mobile: Remember that many shoppers browse on phones
- Avoid misspellings and promotional language: Keep the title professional and compliant
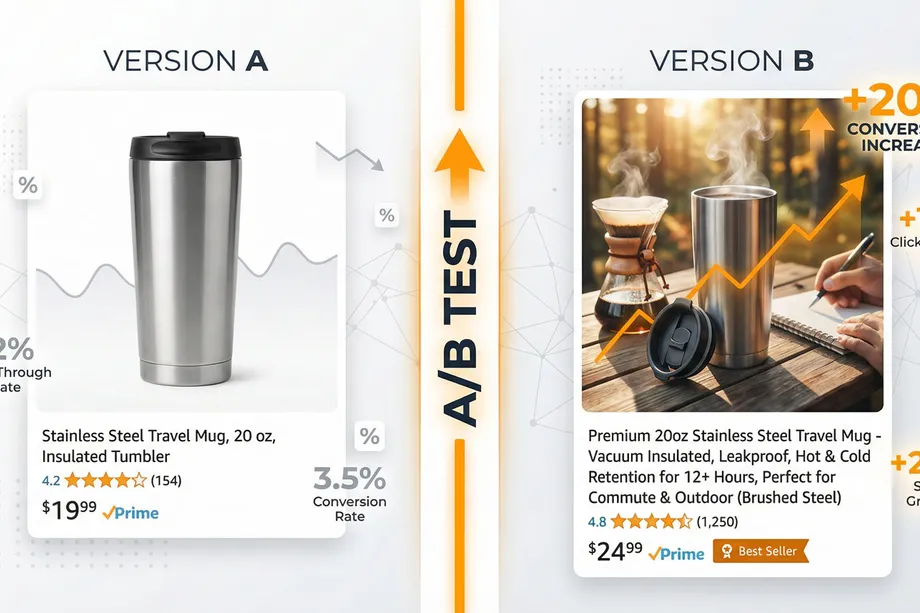
Image Testing: 93% of Buyers Decide Based on Visuals
Here's a startling fact: 93% of shoppers base their purchasing decision on product visuals. This means your main image has an outsized impact on your conversion rate. Yet many sellers never test their images.
Setting Up an Image A/B Test
To test images using Manage Your Experiments:
- Log into Seller Central and navigate to Brands → Manage Experiments
- Click "Create a New Experiment" and select "Product Images"
- Choose your primary product and enter an experiment name and hypothesis
- Upload Version B (Amazon automatically uses your current image as Version A)
- Set your test duration (8-10 weeks recommended, or use "to significance")
- Choose whether to auto-publish the winning image when the test ends
What to Test
The most effective image tests compare:
- Background styles: Pure white background vs. lifestyle/contextual background
- Product angles: Front-facing vs. 45-degree angle vs. overhead shot
- Lifestyle vs. product-focused: Product in use vs. clean product shot
- Color variations: If your product comes in multiple colors
Amazon Image Guidelines
Before you upload, ensure your images comply with Amazon's requirements:
- Main image must have a pure white background (RGB 255, 255, 255)
- Product must fill at least 85% of the frame
- No text, logos, borders, or watermarks on the main image
- Only one unit of the product (no props or accessories)
- High resolution and mobile-optimized
Analyzing Image Test Results
Focus on these metrics:
- Click-Through Rate (CTR): How often the image gets clicked in search results
- Conversion Rate: What percentage of visitors buy
- Units Ordered: Total units sold during the test period
- Statistical Significance: Is the difference real or due to chance?
A winning image might increase CTR by 10-20% and conversion rate by 5-15%, depending on your category and baseline performance.
Bullet Points and A+ Content: Building Trust and Clarity
While your title and image drive clicks, your bullet points and A+ content drive conversions. These sections give shoppers the detailed information they need to make a purchase decision.
Bullet Point Best Practices
Amazon gives the most weight to the first 1,000 characters of your bullet points. Use this prime real estate wisely:
- Lead with benefits, not features: Instead of "Made from stainless steel," say "Durable stainless steel that lasts for years"
- Address common concerns: If customers frequently ask about durability, warranty, or compatibility, answer it in your bullets
- Use scannable formatting: Short sentences, clear structure, easy to skim
- Include specifics: Dimensions, quantities, materials, compatibility information
- Organize by intent: Features, use cases, benefits, audience
A+ Content Strategy
A+ Content (also called Enhanced Brand Content) replaces the basic product description with rich visuals and formatted text. The impact is significant:
- Basic A+ Content: +8% average sales lift
- Premium A+ Content: +20% average sales lift
Effective A+ Content includes:
- Comparison charts (your product vs. alternatives)
- Lifestyle images showing the product in use
- Infographics highlighting key benefits
- Brand story and company information
- Interactive modules (for Premium A+)
Pricing Psychology and Competitive Positioning
Price directly impacts both CTR and conversion rate. Shoppers compare prices quickly, and if your product is significantly more expensive than alternatives, they'll click away. But pricing isn't just about being the cheapest-it's about perceived value.
Pricing Strategies That Work
- Price anchoring: Show the original price crossed out, with your sale price highlighted
- Psychological pricing: $29.99 converts better than $30.00
- Dynamic pricing: Adjust your price based on competitor prices and demand
- Coupons and deals: Offer time-limited discounts to create urgency
Monitoring Competitor Prices
Winning the Buy Box often requires competitive pricing. Monitor your top 5-10 competitors' prices regularly. If they drop, you may need to adjust. If they raise prices, you have room to optimize your margin. The Product Offer operation is especially useful for tracking seller-level price shifts and Buy Box pressure.
Competitor Analysis: The Secret to Staying Ahead
You can't optimize in a vacuum. To truly understand what works, you need to analyze what your competitors are doing-and what's working for them.
Finding Your Real Competitors
Start by searching for your primary keywords on Amazon. The products that appear in the top 10-20 results are your direct competitors. These are the listings you should analyze most closely.
What to Analyze
For each competitor, examine:
- Title structure: What keywords do they prioritize? How do they organize information?
- Images: Do they use white backgrounds or lifestyle shots? What angles do they use?
- Bullet points: What benefits do they emphasize? How do they address concerns?
- Pricing: How do they position their price relative to alternatives?
- Reviews: What do customers praise? What do they complain about?
- A+ Content: Do they have it? How sophisticated is it?
- Estimated sales: How many units are they selling per month?
Benchmarking Your Performance
Compare your metrics to competitors (you can also benchmark category demand with our Amazon BSR guide):
- Review count and rating: Do you have more or fewer reviews? Better or worse rating?
- Price: Are you more or less expensive? By how much?
- Estimated revenue: Are they outselling you? By how much?
- Keyword coverage: Are there keywords they rank for that you don't?
This benchmarking reveals gaps in your strategy. Maybe competitors are using keywords you haven't targeted. Maybe they have A+ Content and you don't. Maybe their images are more compelling. These insights guide your optimization priorities.
Extracting Competitor Data with Easyparser: Scaling Your Analysis
Effective amazon seo strategies require data at scale, but manual competitor analysis is too slow. Analyzing 10-20 competitors manually might take hours. What if you could extract data from 100+ competitors in minutes?
What is Easyparser?
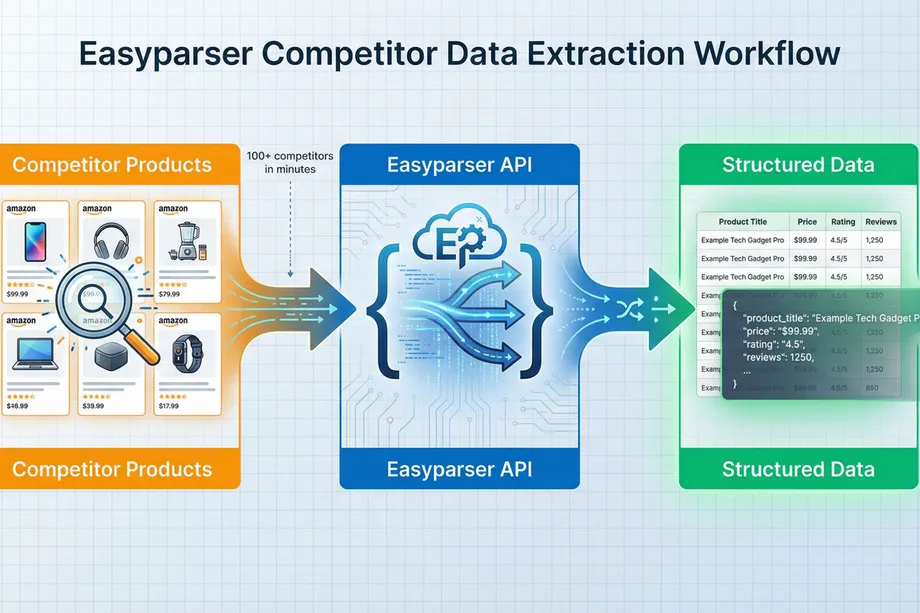
Easyparser is an API-based data extraction tool that simplifies pulling Amazon product data at scale. Instead of manually visiting each competitor's listing, you can programmatically extract:
- Product titles and descriptions
- Pricing and availability
- Review counts and ratings
- Seller information
- Sales history and trends
- Keyword rankings
The data comes back in clean, structured JSON format-ready for analysis.
Practical Use Cases for Competitor Analysis
Scenario 1: Title Keyword Analysis
Extract the titles of your top 50 competitors. Analyze which keywords appear most frequently. Identify high-volume keywords that you're not currently targeting. Update your title to include these gaps.
Scenario 2: Price Monitoring
Set up automated price extraction for your top 10 competitors. Track price changes over time. When competitors drop prices, you're alerted immediately so you can adjust your strategy.
Scenario 3: Review Analysis
Extract reviews from top competitors. Analyze common complaints and praise. Use this insight to improve your product or highlight benefits that competitors are missing.
Scenario 4: Market Research
Extract data from all products in a category. Analyze price distributions, review patterns, and estimated sales volumes. Identify market gaps and opportunities.
Getting Started with Easyparser
The process is straightforward:
- Sign up: Create a free account at Easyparser (100 free credits/month)
- Get your API key: Copy your unique API key from your dashboard
- Make your first request: Use a simple Python script to extract data from an Amazon product
- Analyze the results: You'll receive clean JSON data ready for analysis
For example, a simple Python script can extract product details:
import requests
API_KEY = "YOUR_API_KEY" # Get your key from app.easyparser.com
ASIN = "B098FKXT8L"
params = {
"api_key": API_KEY,
"platform": "AMZ",
"operation": "DETAIL",
"asin": ASIN,
"domain": ".com"
}
response = requests.get("https://realtime.easyparser.com/v1/request", params=params)
data = response.json()
product = data.get("product", {})
print(f"Title: {product.get('title')}")
print(f"Price: ${product.get('price')}")
print(f"Rating: {product.get('rating')} stars")
The result is clean, structured data you can immediately use for competitive analysis.
A/B Testing Best Practices: Avoiding Common Mistakes
A/B testing is powerful, but only if you do it right. Here are the most common mistakes sellers make-and how to avoid them.
Mistake 1: Testing Multiple Variables at Once
The problem: If you change both your title and your image at the same time, you won't know which change drove the improvement.
The solution: Test one variable at a time. Change only your title in one test. Change only your image in another test. This isolation lets you attribute results to specific changes.
Mistake 2: Running Tests During Major Shopping Events
The problem: Prime Day, Black Friday, and holiday shopping periods create artificial spikes in traffic and conversion rates. Testing during these periods skews your results.
The solution: Run tests during normal shopping periods. Avoid major sales events and seasonal peaks.
Mistake 3: Ending Tests Too Early
The problem: If you end a test after 2 weeks, you might not have enough data for statistical significance. Random variation might make one version look better when it's actually just luck.
The solution: Run tests for at least 8-10 weeks. Use Amazon's "to significance" option if you want the algorithm to decide when you have enough data.
Mistake 4: Ignoring External Factors
The problem: A competitor might have launched a similar product, or a major retailer might have started selling your product. These external factors can skew your test results.
The solution: Document external events during your test period. When analyzing results, consider whether external factors might have influenced the outcome.
The Conversion Rate Optimization Flywheel
Here's the powerful cycle that successful Amazon sellers understand:
- Optimize your listing: Better title, images, and content
- Higher conversion rate: More visitors buy
- Better algorithm signals: Amazon sees your product converting well
- Improved ranking: You rank higher for your target keywords
- More impressions: More shoppers see your product
- More sales: Higher volume and revenue
- Back to step 1: Continue optimizing based on new data
This flywheel is the engine of sustainable growth. Small improvements in conversion rate, driven by smart amazon seo strategies like A/B testing, lead to better rankings, more traffic, and more sales. The sellers who understand and leverage this flywheel dominate their categories.
Putting It All Together: Your A/B Testing Action Plan
Ready to start? Here's your step-by-step action plan:
Week 1-2: Analysis and Planning
- Analyze your top 10 competitors using Easyparser or manual analysis
- Identify gaps in your title, images, and content
- Determine your first test (title, image, or bullet points)
- Create your test hypothesis (e.g., "Lifestyle images will increase CTR by 15%")
Week 3: Test Setup
- Create your Version B (new title, image, or content)
- Set up your experiment in Manage Your Experiments
- Configure test duration (8-10 weeks)
- Document your test parameters
Week 3-12: Test Execution
- Let the test run undisturbed
- Monitor for external factors that might skew results
- Don't make other major changes to your listing
Week 13: Analysis and Implementation
- Review your test results
- Check for statistical significance
- Implement the winning version
- Plan your next test
Ongoing: Continuous Improvement
- Run tests continuously (one test after another)
- Track cumulative improvements over time
- Use Easyparser to monitor competitor changes
- Adjust your strategy based on market trends
Conclusion: Data-Driven Success on Amazon
Amazon selling in 2026 is no longer about guesswork-it's about data. The most successful sellers are those who implement data-driven amazon seo strategies. They leverage A/B testing, understand conversion metrics, and systematically optimize their listings to win market share and scale revenue.
The good news? You now have the tools and knowledge to join them. Manage Your Experiments gives you the testing framework. Your research (using tools like Easyparser) gives you the competitive insights. And this guide gives you the strategy.
Start with your biggest opportunity-whether that's title optimization, image testing, or A+ content. Run your first test. Measure the results. Implement the winner. Then repeat. Over time, these incremental improvements compound into significant revenue growth.
The sellers who start testing today will be the ones dominating their categories tomorrow.
Start optimizing your Amazon strategy today
Start Your Free Trial100 free credits, no credit card required.