Introduction: Navigating the High-Stakes World of Amazon's Q4
For Amazon sellers, the fourth quarter (Q4) is not just another sales period; it's the Super Bowl of e-commerce. Representing anywhere from 35% to 60% of a seller's annual revenue, this golden quarter is a make-or-break season. However, this massive opportunity comes with a significant challenge: inventory management. Miscalculating your inventory needs can be catastrophic. Stockouts lead to lost sales and a drop in your Best Seller Rank (BSR), while overstocking results in crippling storage fees and tied-up cash flow. The key to navigating this high-stakes environment is moving from guesswork to a data-driven strategy. This is where seasonal inventory planning, powered by historical sales data, becomes your most valuable asset. In this guide, we will explore a step-by-step methodology to master your Q4 inventory, leveraging powerful tools and advanced forecasting techniques to ensure you are perfectly stocked for the holiday rush.
Why Historical Sales Data is Critical for Seasonal Planning
In the fast-paced world of Amazon, relying on intuition or simple year-over-year assumptions is like navigating a storm without a compass. Market dynamics, consumer behavior, and competitive pressures are constantly shifting. A data-driven approach, grounded in at least 12 months of historical sales data, provides the clarity needed to make informed decisions. This historical perspective allows you to identify recurring seasonal patterns, understand annual growth trends, and pinpoint the impact of specific events like Black Friday and Prime Day. Furthermore, analyzing your product's BSR history offers invaluable insights into its sales velocity and competitive standing within its category. By understanding these historical trends, you can move beyond reactive ordering and build a proactive seasonal inventory planning strategy that maximizes profitability and minimizes risk.
The Limitations of Guesswork and Intuition
Many sellers fall into the trap of thinking, "Last year's numbers plus 10% should be enough." This approach ignores the nuances of market evolution. A new competitor, a shift in consumer preferences, or a change in Amazon's algorithms can render last year's data obsolete if not analyzed in the proper context. Guesswork leads to a constant cycle of being either overstocked or understocked, both of which erode your profit margins.
Data-Driven Decision Making: The Competitive Advantage
The competitive advantage in today's e-commerce landscape belongs to those who can effectively collect, analyze, and act on data. By leveraging historical data, you can understand the true sales velocity of your products, identify which items are your seasonal stars, and optimize your cash flow by investing in the right inventory at the right time. Tools that provide automated access to this data, like Easyparser's Sales Analysis & History API, are no longer a luxury but a necessity for any serious Amazon seller.
Understanding Seasonal Demand Patterns on Amazon
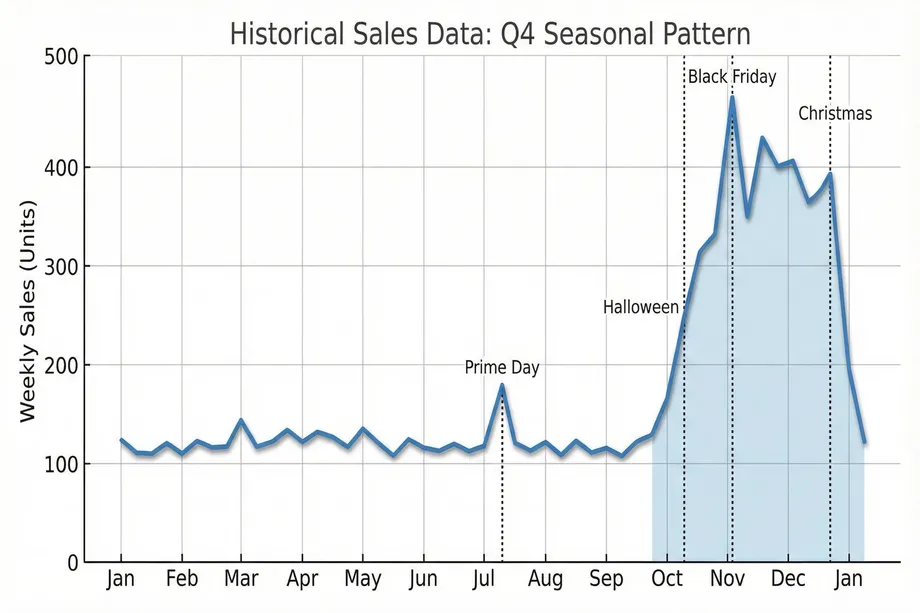
Seasonal demand on Amazon is not a monolithic entity. It's a complex interplay of major holidays, platform-specific events, and category-specific trends. Understanding these patterns is the first step in building an effective inventory plan. Q4 is the most prominent example, with sales steadily climbing from October through December, but other seasons have their own unique characteristics. For example, fitness products see a surge in January, while outdoor goods peak in the summer months. A granular, week-by-week analysis of your historical sales data is crucial to uncovering these patterns and aligning your inventory with consumer purchasing behavior.
Q4 Seasonality: The Golden Quarter
The fourth quarter is a period of frenzied shopping activity. In 2022, Amazon's Q4 revenue hit a staggering $149.2 billion, underscoring the immense potential for sellers. This period is not a single, sustained peak but a series of waves, each driven by a specific event. Understanding the timing and impact of these events is critical for effective seasonal inventory planning.
Key Events That Drive Demand Spikes
- Halloween (Late October): The unofficial start of the holiday shopping season, driving sales in costumes, decorations, and candy.
- Black Friday / Cyber Monday (November): The largest shopping weekend of the year, characterized by deep discounts and a surge in electronics, toys, and gift items.
- Christmas (December): The final push for holiday gifts, with a focus on last-minute purchases and expedited shipping.
- Prime Day (July): While not in Q4, Prime Day's performance is a key indicator of consumer appetite and provides valuable data for Q4 forecasting.
Category-Specific Seasonal Variations
Not all products follow the same seasonal curve. While toys and electronics dominate Q4, other categories have their own unique peaks and troughs. For example, the "New Year, New You" phenomenon drives a massive spike in fitness and wellness products in January. Similarly, categories like Home & Garden see increased demand in the spring. A successful seller must understand the specific seasonality of their niche to avoid costly inventory mistakes.
Step-by-Step: Collecting Historical Sales Data with Easyparser
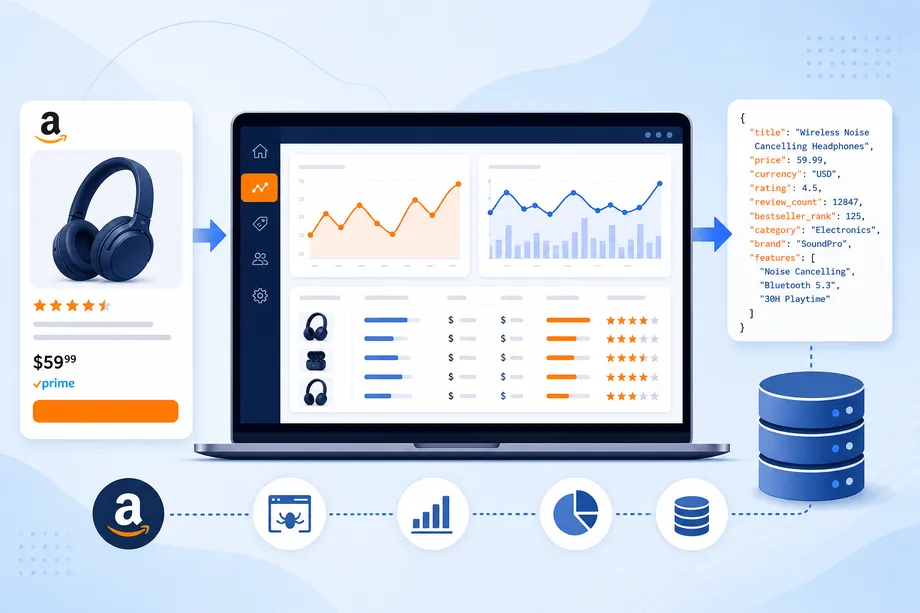
Accurate forecasting begins with high-quality data. Manually compiling this data from Seller Central is a tedious and error-prone process. This is where Easyparser's suite of APIs becomes a game-changer, providing automated, structured, and comprehensive data in a developer-friendly JSON format. By combining the Detail API for current metrics with the powerful Sales Analysis & History API for long-term trends, you can build a complete picture of your product's performance.
What Data Points You Need for Accurate Forecasting
To build a robust forecasting model, you need a variety of data points that go beyond simple sales numbers. These include current pricing and stock levels, historical sales and BSR trends, offer counts to gauge competition, and conversion metrics to understand demand. Easyparser is uniquely positioned to provide all of this data through its specialized, Amazon-focused APIs.
Using Easyparser Detail API for Current Product Metrics
The Detail API provides a real-time snapshot of a product's current status on Amazon. This is your baseline for any analysis. With a simple API call, you can retrieve essential metrics like the current price, BSR, and stock availability.
import requests
API_KEY = "YOUR_API_KEY" # Get your key from app.easyparser.com
ASIN = "B098FKXT8L"
params = {
"api_key": API_KEY,
"platform": "AMZ",
"operation": "DETAIL",
"asin": ASIN,
"domain": ".com"
}
response = requests.get("https://realtime.easyparser.com/v1/request", params=params)
data = response.json()
product = data.get("product", {})
print(f"Title: {product.get('title')}")
print(f"Price: ${product.get('price')}")
print(f"BSR: {product.get('best_seller_rank')}")
Leveraging Sales Analysis & History API for 12-Month Trends
This is where Easyparser truly shines and offers a capability that competitors lack. The Sales Analysis & History API is your time machine, allowing you to pull up to 12 months of weekly historical data for any product. This includes sales volume, BSR, pricing, and offer counts, providing the rich dataset needed for accurate time-series forecasting. It also delivers invaluable conversion metrics by showing the correlation between product page views and actual purchases over the last 30 days.
params = {
"api_key": API_KEY,
"platform": "AMZ",
"operation": "SALES_ANALYSIS",
"asin": ASIN,
"domain": ".com",
"history_range": 12
}
response = requests.get("https://realtime.easyparser.com/v1/request", params=params)
data = response.json()
# Current metrics
views = data.get("total_views")
purchases = data.get("purchases")
conversion_rate = (purchases / views) * 100
# Historical data
history = data.get("history", [])
for week in history:
print(f"Week: {week['week']}, Sales: {week['sales']}")
Demand Forecasting Methods: From Basic to Advanced
With your historical data in hand, the next step is to forecast future demand. There are several methods to approach this, ranging from simple growth factors to sophisticated time-series models. For Amazon sellers, a hybrid approach often works best, using a powerful model like Prophet for the baseline forecast and then layering on business-specific knowledge and promotional plans. This combination of statistical rigor and domain expertise is key to accurate demand forecasting.
Basic Method: Year-over-Year (YoY) Growth Factor
The simplest method is to calculate your year-over-year growth rate and apply it to last year's sales numbers. For example, if you grew 25% year-to-date, you would apply a 1.25 multiplier to last year's Q4 sales. While basic, this method can be a useful starting point, especially when combined with promotional modifiers for planned advertising campaigns.
Advanced Method: Time-Series Forecasting with Prophet
For a more accurate and automated approach, time-series forecasting models are the way to go. While traditional models like ARIMA exist, they can be complex to implement. A more modern and user-friendly alternative is Prophet, a library developed by Facebook (Meta). Prophet is specifically designed to handle the kind of data common in business applications, with strong seasonality, missing data points, and the impact of holidays. It automatically detects yearly, weekly, and daily seasonal patterns and allows you to add custom events like Prime Day, making it an ideal tool for Amazon sellers.
import pandas as pd
from prophet import Prophet
# Convert Easyparser history to a DataFrame
df = pd.DataFrame({
'ds': [ ... weekly dates ... ],
'y': [ ... weekly sales ... ]
})
model = Prophet(yearly_seasonality=True, weekly_seasonality=True)
model.add_country_holidays(country_name='US')
model.fit(df)
future = model.make_future_dataframe(periods=12, freq='W')
forecast = model.predict(future)
print(forecast[['ds', 'yhat', 'yhat_lower', 'yhat_upper']].tail(12))
Calculating Safety Stock and Reorder Points
Your forecast tells you what you expect to sell, but reality is rarely that neat. Supply chain delays and unexpected demand spikes are inevitable. This is where safety stock comes in. It's a buffer inventory that protects you from these uncertainties, ensuring you don't stock out at critical moments. The goal is to find the right balance: enough safety stock to achieve your desired service level without tying up excessive capital in inventory. The safety stock calculation is a core component of any robust inventory strategy.
Understanding Safety Stock: Your Buffer Against Uncertainty
Safety stock is designed to protect against two primary sources of variability: demand variability (your sales are higher than forecasted) and supply variability (your supplier takes longer than expected to deliver). By calculating the right amount of safety stock, you can significantly reduce your risk of stockouts and maintain a high level of customer satisfaction.
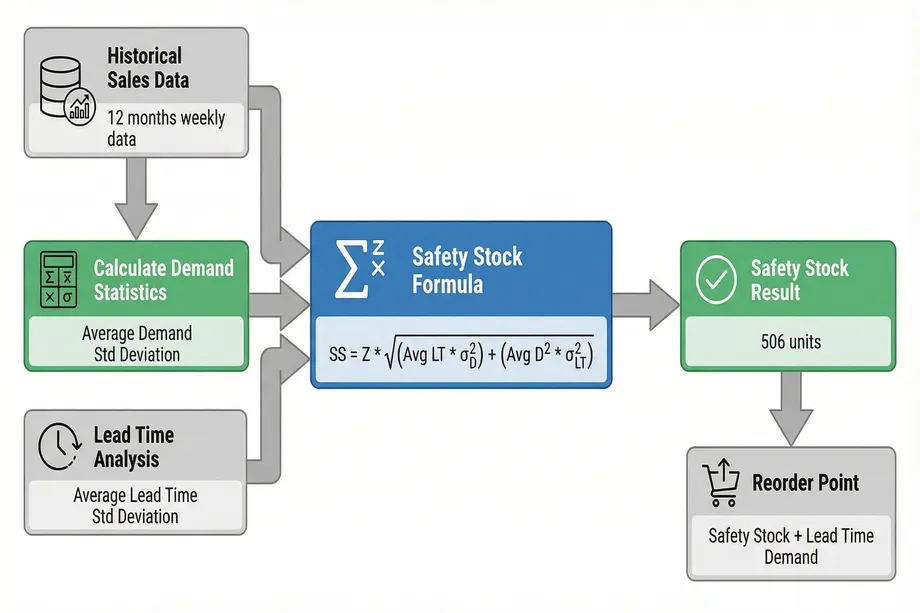
The Best Safety Stock Formula for Amazon Sellers
While several formulas exist, the most widely accepted and comprehensive method for Amazon sellers is the one that accounts for both demand and lead time variability. This formula provides a statistically sound way to determine your safety stock based on your desired service level (the percentage of time you want to avoid a stockout).
Formula: Safety Stock = Z × √[(σ_demand² × Lead Time) + (Average Demand² × σ_lead_time²)]
Where 'Z' is your service factor (e.g., 1.65 for a 95% service level), 'σ_demand' is the standard deviation of your demand, and 'σ_lead_time' is the standard deviation of your lead time.
import numpy as np
Z = 1.65 # 95% service level
avg_demand = 100
std_demand = 20
avg_lead_time = 10
std_lead_time = 3
safety_stock = Z * np.sqrt(
(std_demand**2 * avg_lead_time) +
(avg_demand**2 * std_lead_time**2)
)
print(f"Safety Stock: {safety_stock:.0f} units") # Output: 506 units
Reorder Point Calculation with Lead Time Considerations
Once you have your safety stock, you can calculate your reorder point. This is the inventory level that triggers a new order. The formula is simple: Reorder Point = Safety Stock + (Average Daily Sales × Lead Time). This ensures that by the time your new inventory arrives, you will have just enough stock to cover sales during the lead time, with your safety stock remaining as a buffer.
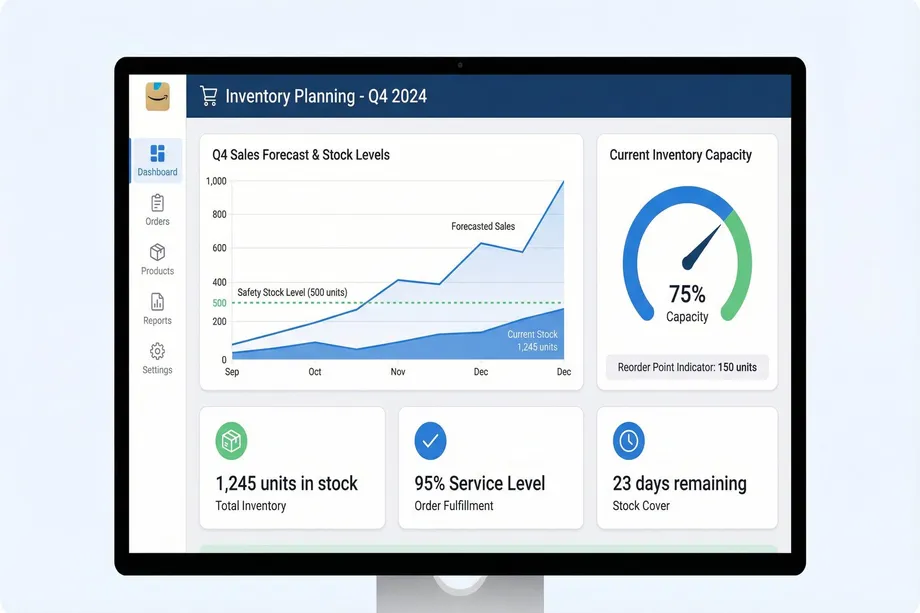
Building an Inventory Planning Dashboard
The true power of this data-driven approach is realized when you bring all these metrics together into a centralized dashboard. A well-designed dashboard provides an at-a-glance view of your inventory health, automates your key calculations, and allows you to perform "what-if" scenario modeling. Whether you choose to build this in Excel or with a more dynamic Python-based tool like Streamlit, a dashboard transforms your seasonal inventory planning from a complex task into a streamlined, manageable process.
Key Metrics to Track on Your Dashboard
- Current Stock Level: Your real-time inventory count.
- Reorder Point: The trigger for your next purchase order.
- Days of Inventory Remaining: How long your current stock will last at the forecasted sales rate.
- Forecast Accuracy: How your actual sales compare to your forecast.
- Safety Stock Coverage: How many days of buffer your safety stock provides.
- IPI Score: Your Inventory Performance Index, which can impact your storage limits.
Q4 Preparation: A Practical Timeline
Q4 success is not achieved in October; it's the result of careful planning that begins in the summer. A structured timeline ensures that you have ample time for data analysis, forecasting, and placing orders with your suppliers, especially considering the extended lead times common during this busy season.
July-August: Data Collection and Analysis
This is the time to gather your data. Use the Easyparser Sales Analysis & History API to pull the last 12 months of sales data. Analyze the performance of your products during last year's Q4 and Prime Day. Identify your top performers and potential breakout products.
September: Forecasting and Order Placement
With your data in hand, build your Prophet forecasting model. Calculate your safety stock and reorder points for each key product. Communicate with your suppliers to understand their holiday lead times and production capacity. Place your initial Q4 orders, keeping in mind that lead times can often be 60-90 days.
October-December: Monitoring and Adjustments
Once Q4 begins, your job shifts to monitoring and adjusting. Track your weekly sales against your forecast. Be prepared to place emergency restock orders if a product is selling faster than anticipated. Keep a close eye on your IPI score to avoid any storage limitations.
Common Mistakes to Avoid in Seasonal Planning
Even with the best data, there are common pitfalls that can derail your seasonal planning. Avoiding these mistakes is just as important as following the right steps.
- Using Insufficient Historical Data: Relying on only a few months of data will not reveal true seasonal patterns. A minimum of 12 months is essential.
- Ignoring Lead Time Variability: Assuming your lead time is constant is a recipe for disaster. Always factor in potential delays.
- Forgetting Marketing Impact: A major advertising campaign will increase demand. Your inventory plan must be synchronized with your marketing plan.
- Neglecting the IPI Score: A low IPI score can lead to storage limits right when you need them most. Manage your inventory effectively year-round to keep your score healthy.
Ready to Master Seasonal Inventory Planning?
Start collecting historical sales data today with Easyparser's Sales Analysis & History API. Get 12 months of weekly sales trends, BSR history, and conversion metrics in seconds.
Start Free TrialConclusion: From Reactive to Proactive Inventory Management
By embracing a data-driven approach, you can transform your inventory management from a reactive, stressful process into a proactive, strategic advantage. The methodology outlined in this guide - from collecting historical data with Easyparser to implementing advanced forecasting with Prophet and calculating statistical safety stock - provides a clear roadmap to success. Effective seasonal inventory planning is the cornerstone of a profitable Q4, allowing you to capture maximum sales, protect your rankings, and optimize your cash flow. The tools and techniques are at your fingertips; it's time to put them to work and make this your most successful holiday season yet.
Start making data-driven decisions today
Start Your Free Trial100 free credits, no credit card required.