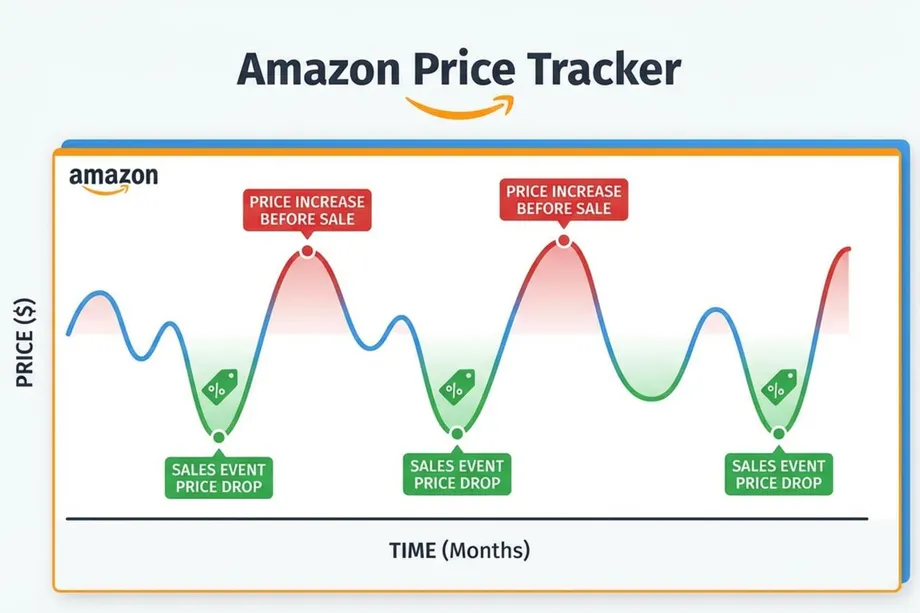
Amazon’s endless aisles and tantalizing "deal" banners can feel like a treasure hunt. But are you finding treasure, or just falling for clever marketing? Many discounts aren’t what they seem, a tactic known as artificial price inflation. This is where a seller raises a product's price for a few weeks, only to drop it back to its normal level during a major sale event like Prime Day or Black Friday, creating the illusion of a significant bargain.
Imagine a smart air fryer listed at $100. A month before a big sale, the seller quietly raises the price to $130. When the sale starts, they slash the price back to $100 and advertise it as "23% off!" You think you're getting a great deal, but you're actually paying the original price. This guide will teach you how to see through these tricks and become a master of finding genuine Amazon bargains.
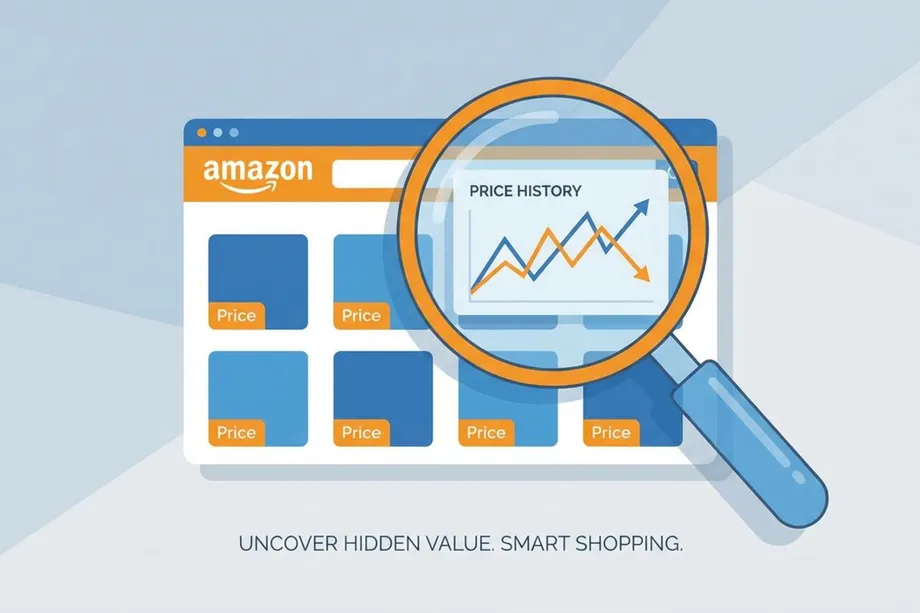
The Secret Weapon: Price History Trackers
Your best defense against fake discounts is data. Price tracking tools act like a time machine for Amazon prices, showing you a product's complete price history. Instead of relying on the seller's claims, you can see for yourself if today's "deal" is actually the lowest price or just a return to the average. It’s like having an expert analyst whispering in your ear, telling you whether to buy now or wait for a better offer.
Top Price Tracking Tools: CamelCamelCamel vs. Keepa
Two of the most powerful and popular price trackers are CamelCamelCamel and Keepa. While both offer similar core features, they cater to slightly different needs.
CamelCamelCamel is the friendly, free option perfect for most shoppers. It offers:
- Price History Charts: Clean, easy-to-read graphs showing price trends for Amazon, third-party new, and third-party used products.
- Price Drop Alerts: Email notifications when a product's price falls below your desired threshold.
- The Camelizer: A browser extension that lets you see price charts directly on Amazon product pages.
Keepa is the power user's choice, offering more granular data and advanced features. It has a free tier, but its most valuable insights are in the paid subscription. Keepa provides:
- Extremely Detailed Charts: Tracks not just price but also sales rank, review counts, and Buy Box history.
- International Price Comparison: Compares prices across all of Amazon's global marketplaces.
- Availability Alerts: Notifies you when an out-of-stock item becomes available.
Here’s a quick comparison to help you choose:
| Feature | CamelCamelCamel | Keepa |
|---|---|---|
| Cost | Free | Freemium (Paid subscription for advanced features) |
| Best For | Casual shoppers and deal hunters | Serious deal hunters, resellers, and data analysts |
| Key Advantage | Simplicity and ease of use | Depth of data and advanced tracking features |
Beyond Price Trackers: More Strategies for Smart Shopping
While price trackers are essential, they're not the only tool in your arsenal. Combine them with these strategies to maximize your savings.
1. Understand Amazon's Deal Types
Not all deals are created equal. Amazon has several types of promotions, each with its own rhythm:
- Lightning Deals: These are short-lived promotions (usually 4-6 hours) with limited stock. They can offer deep discounts but require quick action.
- Deals of the Day: A selection of products discounted for 24 hours.
- Prime Exclusive Discounts: Special offers available only to Amazon Prime members.
2. Know the Best Times to Shop
Major sales events like Prime Day (mid-July), Black Friday, and Cyber Monday are famous for a reason. However, some of the best deals appear randomly. By setting up price alerts on your favorite tools, you'll be notified of these surprise price drops no matter when they happen.
3. Look Beyond the Price Tag
A low price is great, but it's not everything. Always check:
- Seller Reviews: Buy from reputable sellers with a long history of positive feedback.
- Product Reviews: Be wary of products with only a few, overly positive reviews. Look for a healthy mix of feedback.
- "Sold by Amazon": When possible, buy products sold and shipped directly by Amazon for the best customer service and return policy.
For Developers: Unlock Deeper Insights with Historical Data
What if you want to go beyond simple price tracking and build your own tools for market analysis? This is where a powerful scraper API like Easyparser comes in. While consumer tools are great for tracking single products, Easyparser’s `SALES_ANALYSIS_HISTORY` operation is designed for developers and data analysts who need reliable, historical Amazon data at scale.
This operation unlocks a product's performance history, revealing the correlation between traffic (views), sales velocity, pricing, and competition over time. With a single API call, you can retrieve up to 12 months of weekly historical data to make truly data-driven decisions.
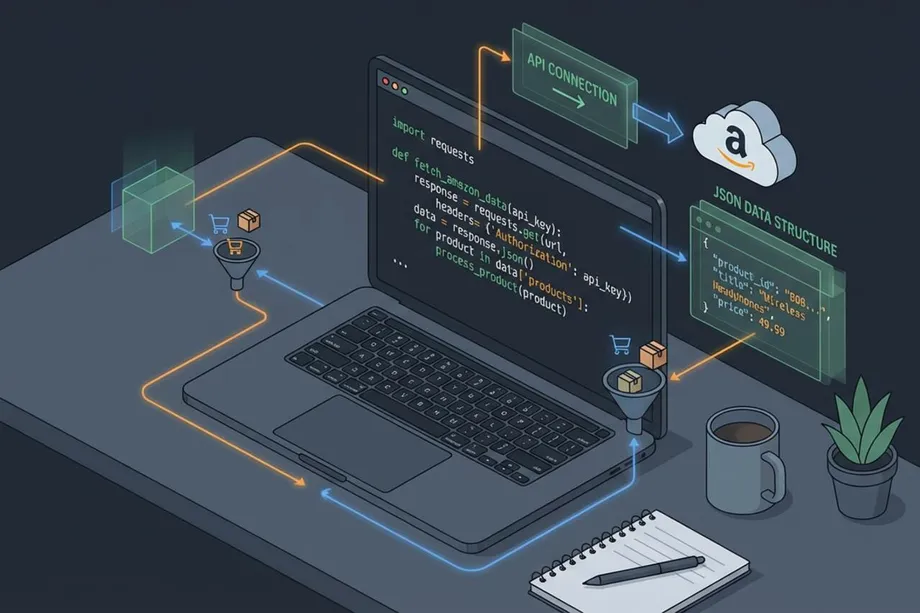
Here’s a Python example of how to fetch 3 months of historical data for a product:
import requests
# Set up the request parameters for historical analysis
params = {
'api_key': 'YOUR_API_KEY',
'platform': 'AMZ',
'operation': 'SALES_ANALYSIS_HISTORY',
'asin': 'B07C2Z21X5',
'history_range': '3',
'domain': '.com'
}
# Make the HTTP GET request to Easyparser API
api_result = requests.get('https://realtime.easyparser.com/v1/request', params=params)
print(api_result.json())
The response includes a `history` array with weekly data points, allowing you to see trends in average price, sales, and more:
{
...,
"result": {
"product": { ... },
"history": [
{
"date": "2025-11-09T00:00:00.000Z",
"views": 22277,
"purchases": 220,
"average_price": 466.96,
"best_seller_rank": 1
},
{
"date": "2025-11-02T00:00:00.000Z",
"views": 8232,
"purchases": 636,
"average_price": 111.04,
"best_seller_rank": 4
},
...
]
}
}
Ready to Unlock Amazon Data?
Get access to reliable historical pricing and sales data for your applications.
How to Read a Price History Chart: A Visual Guide
Price history charts are the most powerful tool a smart Amazon shopper has - but knowing how to read them correctly is just as important as having access to them. Raw data without interpretation leads to poor decisions. Here is what to look for when examining a price history chart for any product.
The most common deceptive pattern is the pre-sale inflation spike. You will see a product's price line that is relatively flat for months, then suddenly jumps 20–40% about 3–6 weeks before a major sale event, only to drop back down right as the sale begins. The "sale price" is actually the original historical price, and the discount percentage is measured against the artificially inflated anchor. This pattern appears with remarkable regularity before Prime Day and Black Friday.
The second pattern to recognize is the true historical low. Every product has a genuine floor price - the lowest it has ever been sold, often during a lightning deal or a period of intense competition. A genuine deal occurs when the current price approaches or breaks this floor. If a product has been $89 for 18 months but is currently $72, that is a real discount worth acting on immediately.
Third, look for seasonal pricing cycles. Electronics tend to be cheapest in October–November as new models launch and retailers clear older inventory. Outdoor and garden products are cheapest in late autumn. Holiday decor is cheapest in January. Buying at the bottom of a seasonal cycle often beats any artificially manufactured sale price.
Finally, check the 30-day and 90-day averages in tools like Keepa. If a product's current price is above its 90-day average, you are almost certainly not getting a deal - regardless of what the listed discount percentage claims.
Deal Stacking: Combining Multiple Discount Types
Even when you have identified a genuine price drop, you can often reduce the cost further through deal stacking - combining multiple simultaneous discount mechanisms. Amazon offers several discount layers that can be applied together:
- Base price discount: The seller reduces the list price, visible in the price history chart as a genuine drop to or below the historical average.
- Coupon: Many product pages have a clickable coupon (e.g., "Click to apply 15% coupon") that applies an additional percentage or fixed-dollar discount at checkout. These are easy to overlook - always scroll down to check for the coupon checkbox before adding to cart.
- Subscribe & Save: For eligible products, enrolling adds a 5–15% discount on top of the current price. You can cancel after the first delivery if you only wanted a one-time purchase.
- Prime Exclusive Discount: Certain products have an additional discount exclusively for Prime members, shown as a strikethrough price with the Prime badge. This stacks on top of the base price and any active coupon.
- Amazon gift card bonus: Occasionally, Amazon offers bonus credit (e.g., "Buy a $50 gift card, get $5 credit") during promotional periods. Using these bonus credits effectively adds another 5–10% off the total.
The combination of a base price at a genuine historical low, plus a coupon, plus a Subscribe & Save discount, plus a Prime Exclusive Discount can result in 30–50% savings off the regular price - far more than any single promotional event typically delivers.
Amazon's Pricing Psychology: Why Prices Drop and Rise
Understanding the forces that drive Amazon's dynamic pricing helps you predict when genuine deals will appear, rather than waiting passively for them.
Inventory-based pricing: When a seller has excess inventory - particularly FBA sellers facing storage fees - repricing algorithms push prices down to accelerate sell-through. Products often reach their lowest price near the end of a large inventory cycle, just before a restock arrives.
Competition-based pricing: Amazon's algorithm monitors all competing sellers for any ASIN. When a new seller enters with a lower price, other sellers' repricing tools respond automatically. This competitive pressure can create genuine price drops with no connection to any planned sale event. Tracking the number of active sellers (visible in Keepa's "New" price chart layer) signals when competitive pressure is building.
Demand-based pricing: Amazon uses purchase velocity, page view volume, and conversion rate to model demand elasticity. Products with declining search traffic see automated price reductions to stimulate sales. Conversely, a viral product can double in price within 24 hours. Waiting a few weeks after hype dies down often rewards patient shoppers with a return to normal pricing.
Building Your Own Amazon Deal Alert System
Consumer price tracking tools are excellent for individual products, but if you want to monitor dozens of products simultaneously or build a custom alert system with your own thresholds, the Easyparser API provides the programmatic access you need. The following Python script fetches a product's current price and compares it to the 90-day historical average, triggering an alert when the current price is at least 15% below average.
import requests, statistics
API_KEY = "YOUR_API_KEY"
ASIN = "B07C2Z21X5"
DEAL_THRESHOLD = 0.15
def get_current_price(asin):
params = {"api_key": API_KEY, "platform": "AMZ", "domain": ".com",
"operation": "DETAIL", "asin": asin}
data = requests.get("https://realtime.easyparser.com/v1/request", params=params).json()
return data.get("result", {}).get("detail", {}).get("price", {}).get("value")
def get_90day_avg(asin):
params = {"api_key": API_KEY, "platform": "AMZ", "domain": ".com",
"operation": "SALES_ANALYSIS_HISTORY", "asin": asin, "history_range": "3"}
data = requests.get("https://realtime.easyparser.com/v1/request", params=params).json()
history = data.get("result", {}).get("history", [])
prices = [h["average_price"] for h in history if h.get("average_price")]
return statistics.mean(prices) if prices else None
current = get_current_price(ASIN)
avg_90d = get_90day_avg(ASIN)
if current and avg_90d:
discount = (avg_90d - current) / avg_90d
if discount >= DEAL_THRESHOLD:
print(f"DEAL ALERT: price is {discount:.0%} below 90d average!")
else:
print(f"No deal: current {discount:.0%} below 90d avg")
Easyparser's DETAIL and SALES_ANALYSIS_HISTORY operations run at 98.2% success rate with 500–900ms response times. At $49/month for 100,000 requests, monitoring 200 products twice daily costs approximately $0.05 per day in API credits. Schedule this script morning and evening to catch both flash deals and end-of-day repricing events.
Start optimizing your Amazon strategy today
Start Your Free Trial100 free credits, no credit card required.