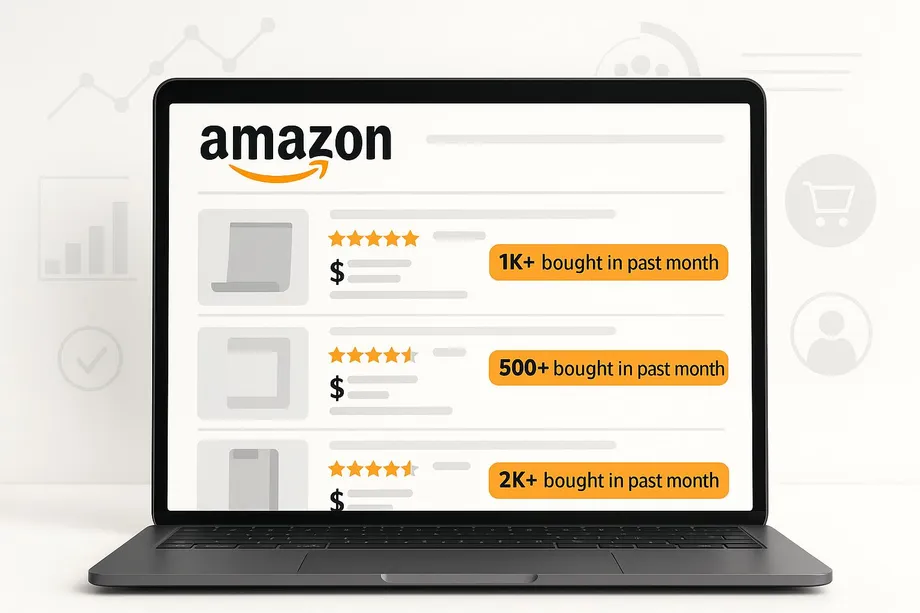
In the crowded marketplace of Amazon, a small line of text can make a huge difference: '1K+ bought in past month'. This simple statement is one of Amazon's most effective forms of social proof, a psychological and social phenomenon wherein people copy the actions of others in an attempt to undertake behavior in a given situation. This guide delves into what this metric means for shoppers and sellers, and how to track it programmatically.
For Shoppers: A Powerful Signal of Trust and Popularity
When you're deciding between two similar products, seeing that one has been purchased by thousands of people recently can be a powerful tie-breaker. For customers, the 'bought in past month' badge provides:
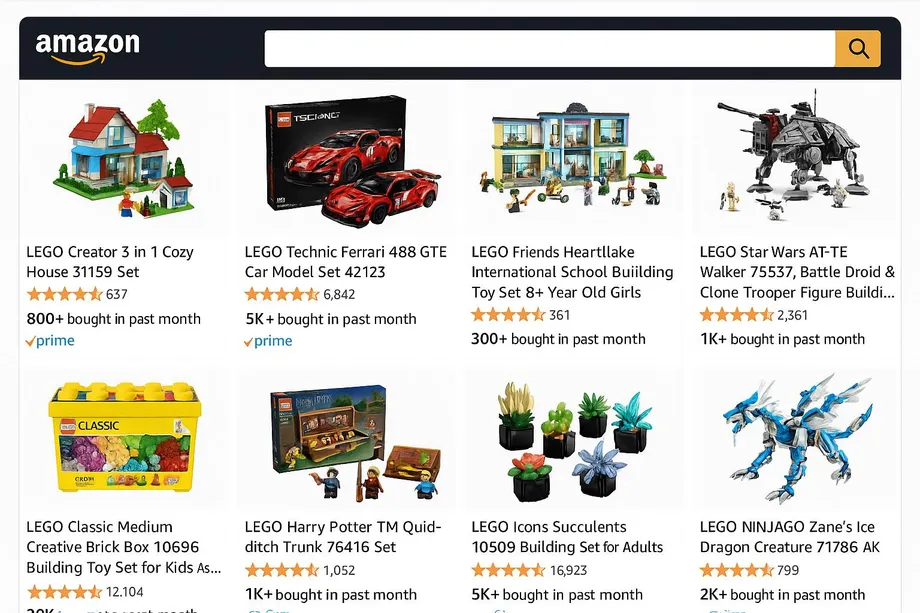
- Instant Social Proof: It confirms that a product is popular and in demand, reducing the perceived risk of making a bad purchase.
- Quality Assurance: While not a direct measure of quality, high sales volume suggests that many previous buyers were satisfied.
- Trend Identification: It helps you quickly spot what's currently trending or popular in a category.
- Decision Confidence: It simplifies the decision-making process by highlighting a community-endorsed choice.
For Sellers: A Key Indicator of Sales Velocity and Market Position
For sellers, the 'bought in past month' badge is more than just a vanity metric; it's a direct reflection of sales velocity and a powerful tool for conversion. Many teams validate this signal with Search Listing snapshots and ASIN-level checks via Product Detail. A strong purchase activity badge can lead to a virtuous cycle: higher visibility leads to more sales, which in turn strengthens the social proof, leading to even more sales.
Amazon displays this data in buckets (e.g., 50+, 100+, 1K+), and getting into a higher tier can significantly impact your product's performance. According to a 2023 analysis by Momentum Commerce, the data is highly accurate, matching actual sales figures over 90% of the time. Sellers should focus on:
- Building Sales Momentum: Especially before peak shopping seasons like Prime Day or Black Friday, driving sales can ensure your product displays a strong 'bought in past month' figure, making it more attractive to the influx of shoppers.
- Competitive Analysis: This metric provides a surprisingly accurate, at-a-glance view of your competitors' sales performance.
- Marketing and Promotions: Use ad campaigns and deals to boost sales velocity and achieve a higher badge tier, which can then sustain organic sales long after the promotion ends.
For Developers: Tracking Purchase Activity with the Easyparser API
While this data is valuable, manually tracking it across hundreds of products is impossible. This is where an API like Easyparser becomes essential. The `bought_activity` object, available in both the SEARCH and DETAIL operations, provides this data in a structured format.
The `bought_activity` Object
When you make a request to Easyparser, the response for a product will contain an object like this:
{
  "bought_activity": {
    "raw": "800+ bought in past month",
    "value": 800,
    "period": "past month"
  }
}
The object provides three key pieces of information:
raw: The exact string displayed on Amazon (e.g., "800+ bought in past month").value: The integer value of the sales bucket (e.g., 800).period: The timeframe of the activity ("past month" or "past week").
Python Example: Fetching Sales Velocity for a List of Products
This Python script demonstrates how to use the Easyparser SEARCH operation to retrieve the purchase activity for the top products for a given keyword. You can extend the same pipeline with Sales Analysis to compare monthly purchase badges against historical demand trends.
import requests
import json
# Easyparser API request parameters
params = {
"api_key": "YOUR_API_KEY",
"platform": "AMZ",
"domain": ".com",
"operation": "SEARCH",
"keyword": "lego sets for adults"
}
# Execute the request
api_result = requests.get("https://realtime.easyparser.com/v1/request", params)
response_data = api_result.json()
search_results = response_data.get("result", {}).get("search", [])
print("Sales Velocity for Top LEGO Sets:")
for product in search_results:
title = product.get("title")
bought_activity = product.get("bought_activity")
if bought_activity:
print(f"- {title[:60]}... -> {bought_activity.get("raw")}")
Conclusion: From Social Proof to Market Intelligence
The 'bought in past month' badge is a prime example of how a simple piece of data can shape consumer behavior and competitive landscapes. For shoppers, it's a beacon of trust. For sellers, it's a target for sales velocity and a tool for conversion. For developers and analysts, it's a quantifiable metric for market share and product momentum. By using an API like Easyparser, brands can move beyond manual observation and integrate this critical social proof data directly into their analytics workflows, turning a simple line of text into actionable market intelligence. For deeper query-level insights, pair this with our Amazon Brand Analytics guide.
How Amazon Calculates 'Bought in Past Month'
Understanding the mechanics behind this badge helps you use the data more accurately. Amazon does not show the exact purchase count — it uses a bucket system that rounds down to the nearest threshold:
| Badge Displayed | Minimum Actual Purchases | Typical Product Stage |
|---|---|---|
| 50+ bought | 50 | New/niche product gaining traction |
| 100+ bought | 100 | Emerging product in category |
| 200+ bought | 200 | Solidly performing product |
| 500+ bought | 500 | Strong seller, competitive niche |
| 1K+ bought | 1,000 | Top performer in most categories |
| 5K+ bought | 5,000 | Category bestseller |
| 10K+ bought | 10,000 | Dominant market leader |
The window is a rolling 30 days, not a calendar month reset. This means the count updates continuously as purchases from 31+ days ago drop off and new purchases come in. The badge only appears when a product crosses the minimum threshold of approximately 50 purchases in the past 30 days — below that, no badge is shown regardless of how many purchases occurred.
A 2023 analysis by Momentum Commerce confirmed that these figures are sourced directly from Amazon's transaction data and are accurate over 90% of the time when compared to independently measured sales data, making them one of the most reliable public-facing sales signals Amazon provides.
Competitive Analysis Using Bought in Past Month Data
For analysts and sellers, the bought-in-past-month data becomes most powerful when used comparatively across an entire product category. Here is how to systematically use it for competitive intelligence:
Estimate Category Market Share
By fetching bought_activity values for all products appearing in the top search results for a keyword, you can construct a rough market share distribution. If the top 5 products in 'wireless earbuds under $50' show values of 10K+, 5K+, 5K+, 1K+, and 500+, you can estimate that the top 3 products command roughly 75% of the recent purchase volume. This is a level of competitive intelligence that would otherwise require expensive third-party tools.
Spot Trending Products Early
A product that was at 100+ last week and now shows 500+ has quadrupled its purchase velocity — a strong signal worth investigating. Is it running a promotion? Did it get featured in a publication? Did a competitor go out of stock? The rate of change in the badge tier is often more informative than the absolute number. Tracking these changes weekly via the Easyparser API gives you an early warning system for market shifts.
Bought in Past Month vs. Best Sellers Rank: What's the Difference?
These two metrics are often confused but they measure fundamentally different things. Understanding the distinction helps you choose the right signal for each use case:
| Aspect | Bought in Past Month | Best Sellers Rank (BSR) |
|---|---|---|
| Time Window | Rolling 30 days | Ongoing weighted average (hours to days) |
| Granularity | Bucket ranges (50+, 100+, 1K+, etc.) | Exact rank integer (e.g., #1,247) |
| Scope | Absolute purchase count | Relative rank within a category |
| What It Signals | Recent consumer demand | Real-time sales velocity vs. competitors |
| Best For | Market research, social proof analysis | Competitive positioning, trend tracking |
| Available via Easyparser | SEARCH and DETAIL operations | RANK_AND_DIMENSION operation |
| Update Frequency | Daily | Hourly |
Use BSR when you need real-time competitive positioning (it updates hourly). Use bought-in-past-month when you need a demand baseline that is less susceptible to short-term promotional spikes. The ideal approach is to track both: BSR tells you where you rank right now; bought-in-past-month tells you whether genuine consumer demand is growing or fading.
Building a Sales Velocity Tracker
Here is an extended Python script that tracks the bought_activity metric for a list of ASINs over time, storing results so you can identify trends:
import requests, json, datetime
API_KEY = "YOUR_API_KEY"
ASINS_TO_TRACK = ["B08N5WRWNW", "B09G9HD57K", "B0B8HVQR8Z"]
def get_sales_velocity(asin):
response = requests.get("https://realtime.easyparser.com/v1/request", params={
"api_key": API_KEY,
"platform": "AMZ",
"operation": "DETAIL",
"domain": ".com",
"asin": asin
})
data = response.json().get("result", {})
return {
"asin": asin,
"title": data.get("title", "")[:60],
"bought_raw": data.get("bought_activity", {}).get("raw", "N/A"),
"bought_value": data.get("bought_activity", {}).get("value", 0),
"price": data.get("price"),
"rating": data.get("rating"),
"timestamp": datetime.datetime.utcnow().isoformat()
}
# Collect and save daily snapshot
daily_snapshot = [get_sales_velocity(asin) for asin in ASINS_TO_TRACK]
with open("velocity_log.jsonl", "a") as f:
for record in daily_snapshot:
f.write(json.dumps(record) + "\n")
print(f"Tracked {record['asin']}: {record['bought_raw']} | ${record['price']}")
Schedule this script to run daily using a cron job or a task scheduler. Over time, you will accumulate a dataset showing how purchase velocity evolves for each ASIN — revealing promotional cycles, seasonal patterns, and competitive responses that are invisible from a single snapshot.
References
[1] Momentum Commerce. (2023). The Story & Data Behind those ‘Bought in Last Month’ Fields on Amazon Searches. Retrieved from: https://www.momentumcommerce.com/amazon-serp-bought-in-last-tags/
[2] Gorilla ROI. (2023). Social Proof Amazon Ultimate Guide. Retrieved from: https://www.gorillaroi.com/social-proof-amazon/
[3] Easyparser Documentation. (n.d.). Search Operation Response. Retrieved from: https://easyparser.gitbook.io/easyparser-documentation/real-time-integration/search/response
Start monitoring your competitors for free
Start Your Free Trial100 free credits, no credit card required.