Amazon is no longer just an e-commerce platform; it is the world's largest search engine for consumer intent. For market researchers and data analysts, the sheer volume of behavioral and transactional data available on Amazon represents an unprecedented opportunity. Whether a Fast-Moving Consumer Goods (FMCG) company is evaluating a new category entry or an enterprise brand is tracking competitor market share, amazon data market research provides the empirical foundation needed for high-stakes business decisions.
Traditional market research relies heavily on surveys, focus groups, and historical sales data, which often suffer from small sample sizes, response bias, and latency. In contrast, Amazon data offers real-time, behavioral insights based on actual purchase decisions and unfiltered customer feedback. This guide explores how analysts can systematically extract and interpret Amazon data to map competitive landscapes, forecast demand, and identify lucrative white space opportunities - covering every major methodology from BSR analysis to price elasticity research.
Why Amazon Is a Goldmine for Market Research
The value of Amazon data for market research lies in its scale and specificity. With over 350 million active products and billions of customer interactions annually, Amazon captures the entire consumer journey - from initial search queries to final purchase and post-purchase feedback. This ecosystem provides a multi-dimensional view of the market that cannot be replicated by traditional research methods.
For analysts, Amazon serves as a real-time laboratory. Instead of asking consumers what they might buy, analysts can observe exactly what they are searching for, how much they are willing to pay, and what features drive their purchasing decisions. This behavioral data is critical for mitigating risk when launching new products or entering unfamiliar categories. By analyzing the performance of existing products, companies can validate demand and refine their value propositions before committing capital to manufacturing and distribution.
The following table summarizes the primary Amazon data types and their corresponding market research applications:
| Amazon Data Type | Market Research Application | Key Metric |
|---|---|---|
| Best Sellers Rank (BSR) | Demand validation and trend detection | Rank movement over time |
| Search keyword data | Purchase intent and consumer language | Search volume and trend direction |
| Customer reviews | Sentiment analysis and product gap identification | Rating distribution and review themes |
| Pricing history | Price elasticity and competitive positioning | Price-to-rank correlation |
| Product detail data | Competitive benchmarking and feature analysis | Feature set comparison across ASINs |
| Seller data | Market concentration and competitive intensity | Number of active sellers per category |
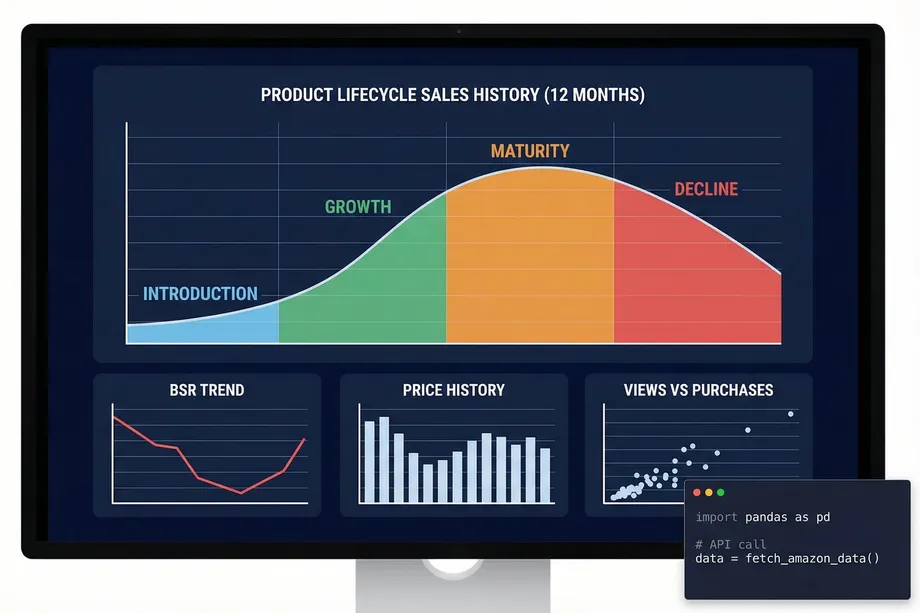
Consumer Demand Signals: BSR and Search Trends
Understanding consumer demand is the cornerstone of any market research initiative. On Amazon, demand signals are primarily quantified through Best Sellers Rank (BSR) and search volume trends. These two data streams, when analyzed together, provide a powerful picture of where consumer interest is growing, plateauing, or declining.
Decoding Best Sellers Rank (BSR)
Best Sellers Rank is a dynamic metric that indicates how well a product is selling relative to others in its category. Amazon updates BSR hourly, making it one of the most responsive demand signals available to analysts. While Amazon does not disclose exact sales volumes, tracking BSR over time provides a reliable proxy for sales velocity and market momentum.
Analysts use BSR data to identify category leaders, track seasonal demand fluctuations, and estimate market size. A product that maintains a consistently low BSR (indicating high sales) demonstrates stable, proven demand. Conversely, significant volatility in BSR may suggest a product relies heavily on promotional discounts or seasonal spikes. A product climbing from BSR 5,000 to BSR 200 over six weeks has passed market validation and still has room to grow - this is a critical entry signal for new market participants.
By leveraging the Easyparser BEST_SELLERS_RANK operation, analysts can programmatically monitor category movements across thousands of ASINs simultaneously, detecting emerging trends before they saturate the market. This API returns real-time BSR data, category context, review velocity, and pricing in a single structured JSON response - eliminating the need for fragile custom scrapers.

Analyzing Search Data for Purchase Intent
Search data reveals the exact language consumers use when looking for products, providing deep insights into their needs and preferences. Analyzing search volume and keyword trends helps researchers understand how the market categorizes products and what specific features are driving interest at any given moment.
For example, a surge in searches for "biodegradable kitchen sponges" indicates a growing consumer preference for sustainable alternatives within a traditional product category. The presence of long-tail keywords like "biodegradable kitchen sponges for sensitive skin" further signals that a specific consumer segment is underserved by current offerings. By monitoring these search trends using the Easyparser SEARCH operation, brands can optimize their product development roadmaps to align with emerging consumer priorities, ensuring new launches meet established demand rather than attempting to create it.
Search trend analysis also reveals the competitive structure of a category. When the first page of search results for a high-volume keyword is dominated by a few large brands with thousands of reviews, the barrier to entry is high. When results are fragmented across many smaller sellers with modest review counts, the category is more accessible to new entrants with differentiated offerings.
Sentiment Analysis from Amazon Reviews
Customer reviews are arguably the most valuable qualitative data source available on Amazon. They represent unfiltered, post-purchase feedback that highlights what consumers love, what they dislike, and what they wish a product included. For market researchers, this data is transformative - it replaces expensive focus groups with a continuous, self-updating stream of authentic consumer voice.
Extracting Actionable Insights from Review Data
For market researchers, reading individual reviews is inefficient at scale. Instead, analysts employ sentiment analysis - using natural language processing (NLP) to categorize review text as positive, negative, or neutral and to extract recurring themes. This approach transforms thousands of individual data points into structured intelligence that directly informs product strategy.
By analyzing hundreds of reviews across a competitor's product line, analysts can identify systemic flaws. If multiple 1-star reviews for a premium coffee maker consistently mention a fragile glass carafe, a competing brand can capitalize on this insight by designing a model with a reinforced or stainless steel carafe. This approach transforms customer complaints into actionable product differentiation strategies that are validated by real consumer data rather than internal assumptions.
import requests
API_KEY = "YOUR_API_KEY" # Get your key from app.easyparser.com
ASIN = "B08N5WRWNW"
params = {
"api_key": API_KEY,
"platform": "AMZ",
"operation": "DETAIL",
"asin": ASIN,
"domain": ".com"
}
response = requests.get("https://realtime.easyparser.com/v1/request", params=params)
data = response.json()
product = data.get("product", {})
print(f"Title: {product.get('title')}")
print(f"Rating: {product.get('rating')} stars")
print(f"Total Reviews: {product.get('reviews_count')}")
Using the Easyparser DETAIL operation, researchers can efficiently extract product metadata, rating distributions, and review statistics to feed into sentiment analysis models. This establishes a robust pipeline for continuous consumer feedback monitoring across entire product categories, not just individual ASINs.
Rating Distribution as a Market Signal
Beyond average star ratings, the distribution of ratings provides nuanced market intelligence. A product with a 3.8-star average composed of 60% five-star reviews and 30% one-star reviews tells a very different story than a product with a 3.8-star average composed of mostly three-star reviews. The former indicates a polarizing product with passionate advocates and a clear, addressable failure mode. The latter suggests a mediocre product that satisfies no one particularly well. Both represent market opportunities, but they require different strategic responses.
Analysts who track rating distributions across a category's top products can identify which segments of the market are genuinely satisfied and which remain frustrated. This intelligence is particularly valuable for FMCG companies evaluating category entry, as it reveals not just whether demand exists, but whether that demand is being adequately served by current offerings.
Competitive Landscape: Mapping the Market
A thorough understanding of the competitive landscape is essential before entering any market. Amazon data market research allows analysts to map out incumbent brands, assess their market share, and evaluate their strategic positioning with a level of granularity that traditional competitive intelligence tools cannot match.
Quantifying the Competitive Moat
Market mapping involves analyzing the top-ranking products within a specific category. Analysts evaluate metrics such as review volume, average rating, pricing tiers, and the presence of A+ content. A category dominated by a few brands with tens of thousands of reviews presents a high barrier to entry - not because the products are necessarily superior, but because the review wall creates a trust signal that new entrants cannot quickly replicate. Conversely, a category where top products have low ratings and few reviews indicates a fragmented market ripe for disruption.
By aggregating this data across the top 20-50 ASINs in a category, researchers can construct a clear picture of the competitive environment, identifying which brands command premium pricing and which compete primarily on cost. This intelligence informs everything from initial product design to final go-to-market strategies, ensuring that new market entrants position themselves in segments where they can realistically compete.
Brand Share-of-Voice Analysis
Beyond individual product analysis, analysts can aggregate BSR data by brand across specific categories to measure brand-level market share. A brand that consistently occupies multiple positions in a category's top 100 BSR rankings commands significant share of voice and consumer mindshare. Tracking how this brand distribution shifts over time reveals whether the market is consolidating around a few dominant players or remaining fragmented - a critical factor in assessing long-term category attractiveness.
Seasonal events like Prime Day and Q4 provide particularly valuable data for share-of-voice analysis. Brands that maintain or improve their BSR rankings during peak periods demonstrate strong operational and marketing capabilities. Those that lose ground during high-traffic periods may be vulnerable to competitive challenges from well-prepared new entrants.
Price Elasticity Research with Historical Data
Pricing strategy is a critical component of market research, and Amazon's dynamic pricing environment offers a wealth of data for elasticity analysis. Amazon updates prices approximately 2.5 million times daily, making it the most dynamic pricing environment in consumer retail. This constant price movement generates a rich dataset for analysts studying how consumer demand responds to price changes.
Understanding Price Sensitivity in Your Target Category
Price elasticity measures how consumer demand responds to changes in price. By tracking historical pricing data alongside BSR movements, analysts can observe how price adjustments impact sales velocity. If a competitor lowers their price by 15% and experiences a significant improvement in BSR, the market is highly price-sensitive. If the BSR remains relatively unchanged despite the discount, consumers in that category likely prioritize brand reputation or specific features over price.
This analysis helps brands determine optimal pricing tiers for new products. It reveals whether there is room in the market for a premium offering or if the category is strictly commoditized, requiring aggressive cost management to achieve profitability. For FMCG companies in particular, understanding price elasticity before launch can prevent the costly mistake of entering a price-sensitive category with a premium-priced product that lacks sufficient differentiation to justify the premium.
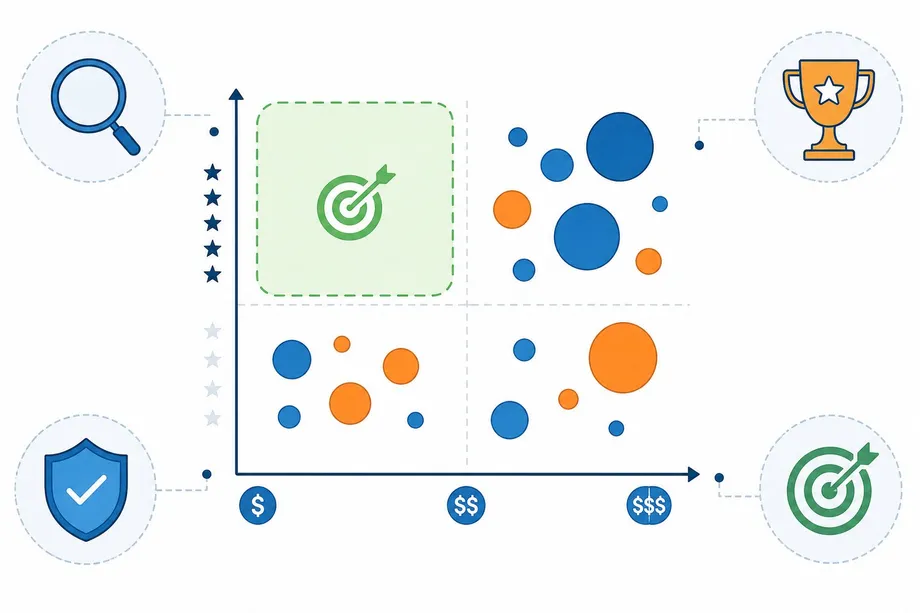
Identifying Price Band Gaps
Price band analysis answers a fundamental market research question: where are the gaps in the current offering landscape? A highly concentrated price band - where 80% of products cluster in a tight range - signals strong consumer price anchoring and leaves very little room for premium positioning without exceptional differentiation. A distributed price band indicates that different product quality tiers have found their buyers, meaning the category still rewards differentiation across multiple price points.
By mapping the price distribution of the top 50 products in a target category, analysts can identify underserved price tiers. A category with strong demand at both the $15-20 and $50-60 price points, but few products in the $30-40 range, may represent an opportunity for a mid-tier offering that captures consumers who find budget options insufficient but cannot justify premium prices.
Identifying White Space Opportunities
The ultimate goal of amazon data market research is to identify white space - unmet consumer needs or underserved market segments that represent profitable opportunities for innovation. Amazon data is uniquely suited for this purpose because it captures both the demand side (what consumers are searching for) and the supply side (what products currently exist and how well they perform).
The Three-Signal White Space Framework
Effective white space identification on Amazon requires synthesizing three distinct data signals simultaneously. The first signal is high search demand - evidence that consumers are actively looking for a product type or feature set. The second signal is poor competitor performance - low ratings, high complaint rates, or frequent stockouts among existing products in the category. The third signal is supply gap - either a limited number of products addressing the specific need or products that exist but fail to satisfy consumers adequately.
When all three conditions align, the result is a clear white space opportunity. For instance, search data might reveal high query volume for "travel-friendly ergonomic pillows," but competitive analysis shows that existing products are either too bulky for carry-on luggage or poorly rated for comfort during long flights. This discrepancy between consumer demand and available supply constitutes a textbook white space opportunity.

Mining Review Gaps for Product Innovation
One of the most powerful white space identification techniques involves systematically mining the negative reviews of top-performing products in a category. When the 1-star and 2-star reviews of the category's best sellers consistently cite the same complaints - a recurring durability issue, a missing feature, or a usability problem - those complaints define the white space. A product specifically engineered to address these documented pain points enters the market with a built-in value proposition that resonates immediately with frustrated consumers.
This approach is particularly effective because it replaces speculation with evidence. Rather than hypothesizing what consumers might want, analysts can identify exactly what they have already told Amazon they need, in their own words, at scale. The resulting product brief is grounded in real consumer voice rather than internal assumptions or expensive primary research.
Building a Market Research Dashboard
To maximize the value of Amazon data, analysts must transition from ad-hoc queries to systematic monitoring. Building a centralized market research dashboard enables continuous intelligence gathering and transforms Amazon data from a research input into an ongoing strategic asset.
Designing the Data Architecture
A robust amazon data market research dashboard integrates multiple data streams into a unified view. The core components include BSR trend tracking for a defined set of competitor ASINs, pricing history for elasticity monitoring, review volume and rating trends for sentiment tracking, and keyword ranking data for search visibility analysis. Each of these data streams requires regular, automated collection to maintain analytical value.
The technical foundation for this architecture is a structured data API. By scheduling automated API calls at defined intervals - hourly for pricing and BSR, daily for review counts, weekly for comprehensive product detail snapshots - analysts can build a continuously updated dataset that supports both real-time alerting and longitudinal trend analysis. The Easyparser API supports all of these collection patterns through a single, consistent endpoint, simplifying the data infrastructure significantly.
Setting Up Automated Market Alerts
Beyond passive monitoring, a well-designed dashboard enables proactive alerting. Analysts can configure automated notifications for significant market events: a competitor's BSR improving by more than 20% in a single week, a new product entering the top 10 in a target category, a major price reduction by a key competitor, or the emergence of a new high-volume keyword in the category's search landscape. These alerts allow research teams to remain agile, investigating market shifts as they occur rather than discovering them weeks later during a scheduled review cycle.
The following table outlines a recommended monitoring cadence for different types of Amazon market research data:
| Data Type | Recommended Frequency | Primary Use Case |
|---|---|---|
| BSR (Best Sellers Rank) | Daily | Demand trend monitoring, competitor health tracking |
| Pricing data | Hourly or daily | Price elasticity research, competitive repricing alerts |
| Search keyword rankings | Weekly | SEO performance tracking, new entrant detection |
| Review count and rating | Weekly | Sentiment trend monitoring, competitive quality tracking |
| Product detail snapshot | Monthly | Listing optimization analysis, feature set benchmarking |
| Seller count per ASIN | Weekly | Market concentration analysis, new competitor detection |
Case Study: Entering a New Category with Data
Consider a global FMCG company planning to enter the highly competitive premium pet food category. Instead of relying on generalized industry reports or expensive consumer surveys, their analytics team utilized amazon data market research to architect their entire entry strategy from the ground up.
The research process began with demand validation. The team analyzed search trends across the pet food category, discovering a rapidly growing segment of consumers searching for "grain-free senior dog food with joint support." BSR analysis confirmed that this sub-category was experiencing consistent growth, with multiple products improving their rankings over the preceding six months. This combination of search growth and BSR momentum provided strong evidence of validated, expanding demand.
The second phase focused on competitive analysis. The team pulled detailed data on the top 15 products in the target sub-category, analyzing their pricing, review counts, rating distributions, and feature sets. The analysis revealed that while several products addressed the grain-free and joint support requirements, all of them used a standard kibble size designed for medium to large dogs. The 1-star and 2-star reviews across these products contained a recurring complaint: the kibble was too large for smaller senior breeds to chew comfortably, causing them to leave food in the bowl or struggle with meals.
This review pattern identified a clear white space. The team then conducted price elasticity analysis on the sub-category, finding that consumers were willing to pay a 20-25% premium for products that specifically addressed the needs of small senior breeds. Armed with this intelligence, the company developed a specialized formula featuring smaller kibble sizes, explicitly highlighting this feature in their product titles, bullet points, and marketing copy.
Upon launch, the product rapidly gained traction. It achieved a top 100 BSR in its sub-category within eight weeks, driven by highly targeted positioning that directly addressed a validated consumer pain point. The product's initial review velocity was strong because it immediately resonated with a frustrated consumer segment that had been underserved by existing options. This case study illustrates the transformative power of systematic amazon data market research: by replacing assumptions with empirical behavioral data, brands can significantly reduce the risk of new product launches and confidently execute data-driven market entry strategies.
Scaling Your Research Infrastructure
As market research programs mature, the volume and complexity of Amazon data collection inevitably increases. A research team monitoring 50 ASINs for a single category entry project may eventually need to track 500 ASINs across multiple categories simultaneously. Scaling this infrastructure requires careful attention to data collection reliability, storage architecture, and analytical tooling.
The most common scaling challenge is maintaining data collection reliability as volume increases. DIY scraping solutions that work adequately at small scale frequently break down under high-volume conditions due to IP blocking, CAPTCHA challenges, and HTML structure changes. Transitioning to a managed API solution eliminates these maintenance burdens, allowing research teams to focus on analysis rather than infrastructure management.
For enterprise-scale research programs, building a data pipeline that feeds Amazon API responses directly into a data warehouse or business intelligence platform is the optimal architecture. This enables analysts to combine Amazon behavioral data with internal sales data, CRM data, and other market intelligence sources for a truly comprehensive view of market dynamics. The structured JSON responses from the Easyparser API are well-suited for this type of pipeline integration, with consistent field naming and comprehensive data coverage that simplifies downstream analysis.
The ultimate measure of a mature amazon data market research program is its ability to generate predictive intelligence, not just descriptive reporting. Teams that have built robust historical datasets can identify leading indicators of market shifts - a BSR pattern that precedes a category growth cycle, a review sentiment trend that signals an impending product recall, or a search keyword emerging that will define the next product generation. This predictive capability transforms market research from a cost center into a genuine competitive advantage, enabling brands to act on market intelligence before their competitors even recognize the opportunity exists.
Start analyzing Amazon data for free
Start Your Free Trial100 free credits, no credit card required.