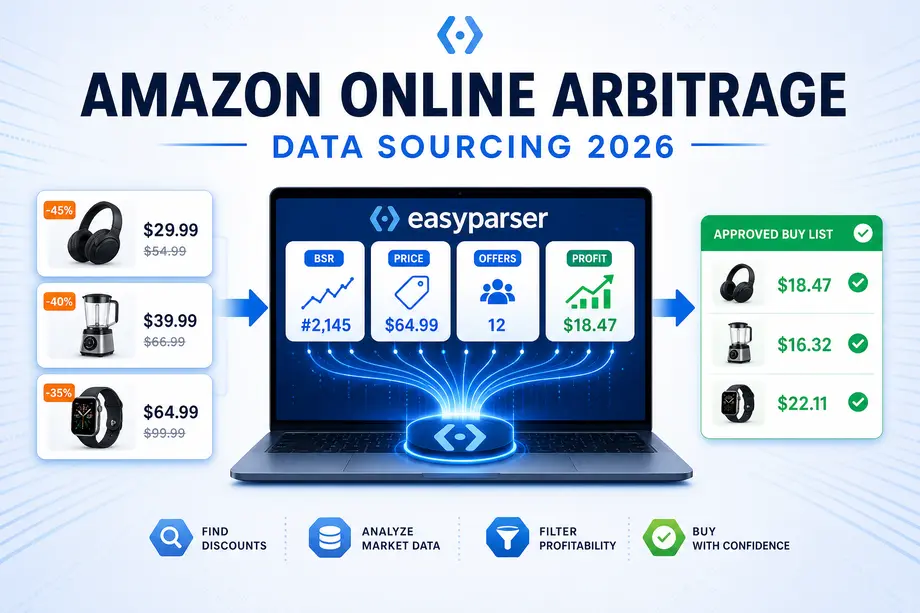
At 8:00 a.m., an online arbitrage seller opens a file containing 100 discounted retail products. The visible price gaps look attractive, but a gap is not a deal. By noon, the seller has rejected 90 products because demand is weak, the Amazon price is temporarily inflated, too many offers are arriving, or the profit disappears under a conservative scenario. The remaining 10 become a buy list. That is the job of amazon online arbitrage data: converting a crowded lead feed into a smaller set of defensible inventory decisions.
This guide assumes you already understand the basic model of buying from an online retailer and reselling on Amazon. It focuses on the data layer that comes next. You will learn how to interpret Best Sellers Rank (BSR), compare retail and Amazon prices, measure offer pressure, find seasonal patterns, calculate downside profit, and automate a daily scanner without allowing software to make compliance decisions for you.
Quick Answer: Use Five Gates, Not One Magic Metric
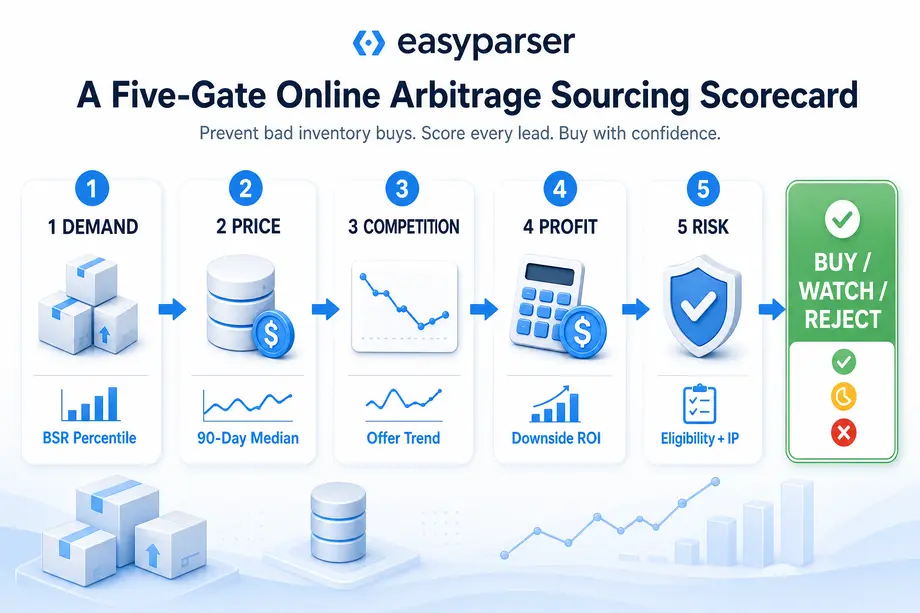
A product should pass five gates before you buy it: demand, price durability, competition, downside profit, and account-specific risk. Each gate answers a different failure mode, so no impressive BSR or margin should override the rest.
| Gate | Primary evidence | Reject or review when |
|---|---|---|
| Demand | Category-relative BSR, BSR trend, purchases, sales consistency | A single good rank is unsupported by history |
| Price | Current Buy Box, 30/90-day median, minimum observed price | Profit exists only at today's unusually high price |
| Competition | Active offers, FBA/FBM mix, Amazon presence, offer-count trend | Offers are rising while price and Buy Box access are falling |
| Profit | Net profit, ROI, margin, break-even price, cash cycle | Downside ROI falls below your portfolio rule |
| Risk | Eligibility, IP exposure, hazmat, size, condition, exact variation | You cannot verify sellability or documentation |
Run the gates in order so cheap checks remove obvious failures before deeper history. A scanner can rank candidates, but the final purchase still requires an account-specific eligibility check and human review of product identity, condition, variation, and invoice quality.
What Amazon Online Arbitrage Data Matters?
The minimum useful record has four layers. Retail fields include source URL, identifier, price, coupon, tax, availability, pack quantity, and delivery cost. Amazon fields include ASIN, variation, category, BSR, price, dimensions, and availability. Offer and historical layers add sellers, fulfillment, shipping, Buy Box status, Amazon presence, purchases, views, and dated price or offer changes.
Keep source and marketplace data separate until identity is confirmed. A 2-pack at a retailer is not the same item as a single-unit Amazon listing. A 12-ounce bottle is not equivalent to a 16-ounce variation. Before calculating margin, match UPC or model number, brand, count, size, color, and condition. Identity errors create false spreads that no profit formula can fix.
BSR Thresholds: How Fast Does a Product Sell?
Amazon defines BSR as sales rank relative to similar items in a category. Recent sales carry more weight than older sales, and one product can have different ranks across categories or stores. A universal rule such as "buy below 100,000" is therefore weak: rank 50,000 can imply very different velocity in Books, Beauty, and Patio.
A better approach converts raw BSR into a category percentile. If a product ranks 5,000 among roughly 500,000 active category items, it sits near the top 1%. If another product ranks 5,000 in a category with 20,000 items, it is only near the top 25%. The first deserves a faster path through the demand gate. The second needs stronger supporting evidence.
Use three BSR views. The current rank is a freshness signal. The 30 or 90-day median describes normal demand. The volatility band shows whether the product is stable or dependent on short bursts. For amazon online arbitrage data, an improving percentile with repeated purchase activity is more useful than one excellent rank after a promotion.
Do not confuse BSR with search position, reviews, or product quality. Treat it as one demand proxy and combine it with purchases, price history, and your expected share of the listing. When data is sparse, lower the first order rather than pretending the uncertainty does not exist.
Price Spread Analysis: Finding Profitable Margins
The visible spread equals Amazon price minus retailer price. The investable spread is smaller because it must absorb tax, source shipping, prep, inbound freight, referral fees, fulfillment, storage, returns, and price erosion. Evaluate at least three selling prices: the current Buy Box, the 90-day median, and a downside price such as the lower quartile or recent stable low.
Consider a product that costs $18.00 at the retailer. Add $1.44 tax, $0.75 source shipping, $1.00 prep, and $0.55 inbound freight. Your landed inventory cost is $21.74. At a current Amazon price of $44.99, after a 15% referral fee, $5.20 fulfillment cost, and $1.20 reserve, estimated profit is $10.10 and ROI is 46.5%. That looks excellent.
Now use a conservative selling price of $39.99. Estimated profit falls to $5.85, ROI to 26.9%, and margin to 14.6%. The deal can still pass if your minimum downside ROI is 25%, but the safe order size should be based on the conservative case, not the spot case. A scanner that reports only the 46.5% figure encourages overbuying.
| Scenario | Selling price | Estimated profit | ROI | Decision use |
|---|---|---|---|---|
| Spot | $44.99 | $10.10 | 46.5% | Shows current upside, not purchase safety |
| Conservative | $39.99 | $5.85 | 26.9% | Sets the normal buy decision |
| Break-even | Calculated from all costs | $0.00 | 0% | Defines the absolute floor |
Offer Count: Avoiding Oversaturated Products
Offer count measures how many sellers can compete for the same listing, but the total alone can mislead. Separate FBA from FBM, identify the Featured Offer holder, record Amazon's presence, and compare sellers by landed price and delivery promise. Ten slow FBM offers may create less pressure than three well-rated FBA sellers at the same price.
Estimate sales share conservatively. If demand is 300 units per month and six comparable FBA sellers rotate evenly, the naive estimate is 50 each. Discount it for seller quality, fulfillment differences, and Amazon dominance, then include storage and price risk for the resulting sell-through period.
Trend matters more than one snapshot. An offer count moving from four to five while price remains stable is different from a count moving from four to twelve as price declines 18%. The second pattern says the public deal may have reached many sellers. A rising offer curve, falling Buy Box, and shrinking downside ROI should trigger WATCH or REJECT even when today's margin still passes.
The Easyparser Product Offers operation can supply active seller offers, fulfillment type, shipping, discounts, reputation signals, and Buy Box ownership for a target ASIN. Store repeated snapshots to build your own offer-count history and identify listings where competition is accelerating.
Sales History: Spotting Seasonal Opportunities
Seasonality is not simply "sales go up in December." Compare the same calendar period across available history, then study price, BSR, purchases, and offers together. A toy with better BSR but collapsing price can sell without creating attractive profit, while a patio item with stable offers before spring may support an early, smaller buy.
The Sales Analysis & History operation provides up to 12 months of views, purchases, price, BSR, and offer-count history when available. Use it to test whether the present signal resembles a normal period or an outlier. Historical evidence does not guarantee future sales, but it makes the uncertainty visible.
Build a Five-Gate Sourcing Scorecard
Score only after removing hard failures. Eligibility failure, product mismatch, unacceptable IP exposure, or negative downside profit should reject a candidate regardless of points.
| Dimension | Weight | Example scoring question |
|---|---|---|
| Demand | 25 | Is category-relative BSR supported by purchases and stable history? |
| Price durability | 20 | Does the conservative price remain above break-even? |
| Competition | 20 | Are comparable offers stable, and is Amazon absent or rotating? |
| Profitability | 25 | Does downside ROI meet the portfolio rule after every cost? |
| Data confidence | 10 | Are identity, timestamp, variation, and history complete? |
Use bands such as BUY at 75 or more, WATCH at 60 to 74, and REJECT below 60, then calibrate them against actual outcomes. A score allocates review time; it never promises profit. Log the rejecting gate for each candidate.
Building an OA Product Scanner with Easyparser
A practical scanner joins retailer candidates to Amazon records by UPC, model, or confirmed ASIN. Product details validate identity and current economics, offers evaluate competition, and historical analysis is reserved for survivors. This staged design controls cost and noise.
The Easyparser Product Detail operation returns current listing fields through a structured JSON response. The Python request below shows the Real-Time API path for an on-demand shortlist check.
import requests
API_KEY = "YOUR_API_KEY"
ASIN = "B0EXAMPLE01"
params = {
"api_key": API_KEY,
"platform": "AMZ",
"operation": "DETAIL",
"asin": ASIN,
"domain": ".com"
}
response = requests.get("https://realtime.easyparser.com/v1/request", params=params)
response.raise_for_status()
product = response.json()
print(product)
Real-Time API vs Bulk API
| Mode | Best OA use | Response pattern |
|---|---|---|
| Real-Time API | Verify a short list immediately before purchase | Synchronous result returned inline |
| Bulk API | Process scheduled multi-product scans and monitoring jobs | Asynchronous job with callback/webhook or later retrieval |
Use Real-Time for the last decision because price and availability can change after an overnight scan. Use Bulk for breadth because a single asynchronous job can process multiple products or operations without forcing an analyst to wait on each request. A sensible pattern is Bulk discovery overnight, scoring at 7:00 a.m., and Real-Time revalidation for BUY candidates before checkout.
Automating Your Sourcing Workflow
Automation should move records, calculate metrics, and enforce repeatable gates. A daily workflow imports retailer leads, confirms identifiers, enriches Amazon fields, calculates price scenarios, fetches offers and history for survivors, then sends BUY or WATCH records to a review queue.
Keep three controls. First, use idempotency so the same ASIN and source offer are not purchased twice. Second, use freshness limits so stale retail prices or Amazon snapshots cannot pass. Third, require manual approval for gated brands, hazmat indicators, multipacks, bundles, and uncertain variations. Track every failure code and retry transient API errors rather than silently dropping products.
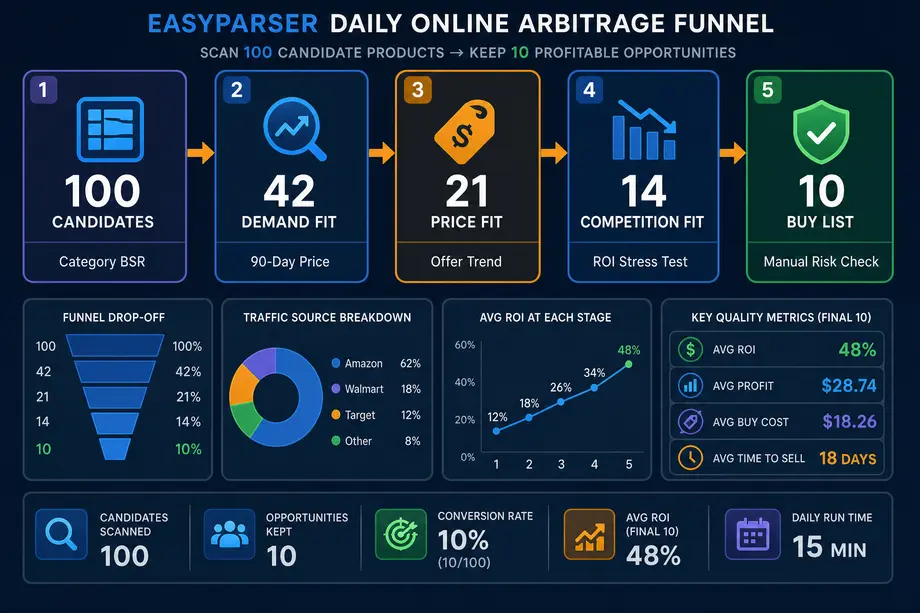
Real Case: Finding 10 Profitable Products in One Day
Consider an illustrative seller scanning 100 retailer leads. This is a workflow example, not a guaranteed conversion rate. The first pass checks identity, eligibility flags, current category-relative BSR, and basic economics. Forty-two candidates show adequate demand and a confirmed match. The rest fail because of weak demand, wrong variations, restrictions, or incomplete source data.
The scanner then compares current price with the 90-day median and conservative price. Twenty-one retain acceptable downside profit. Offer analysis removes seven more because comparable FBA competition is rising, Amazon is persistently present, or seller-share assumptions produce a slow cash cycle. Fourteen reach the history and manual-risk stage. Ten pass and become a buy list.
| Stage | Remaining | Main rejection reason |
|---|---|---|
| Imported leads | 100 | None |
| Demand and identity fit | 42 | Weak BSR evidence, mismatch, or restriction |
| Price durability fit | 21 | Profit depends on a temporary price spike |
| Competition fit | 14 | Rising offers, Amazon dominance, slow expected share |
| Manual risk review passed | 10 | IP, condition, invoice, or operational concern |
The value is not that the workflow found 10 products. Every rejection has a reason and every approval has a downside case. Compare recommendations with realized price, sell-through, returns, and profit; if WATCH products consistently beat BUY products, recalibrate the score.
How to Set Thresholds for Your Own Portfolio
Start from capital constraints, not industry folklore. A seller with $2,000 and limited storage needs faster turnover and smaller lots. A team with a prep center and diversified inventory can accept slower products when margin compensates for time. Define a minimum downside ROI, maximum days to sell, maximum cash per ASIN, and maximum share of capital per brand.
Backtest the thresholds on your own orders. Compare predicted price, predicted days to sell, and predicted profit with actual results. Adjust one rule at a time. Category percentile, offer trend, and price durability should be calibrated by category because return rates, fee structures, and competitive behavior differ.
Measure the scanner itself through candidates reviewed per hour, rejection rate by gate, false positives, realized downside ROI, cash-cycle days, and profit per analyst hour. Better amazon online arbitrage data is a smaller set of reliable fields that improves these outcomes.
Final Decision Checklist
Before ordering, confirm exact variation, account eligibility, coupon conditions, conservative price, full cost, break-even, comparable FBA offers, Amazon presence, historical demand, expected share, invoice quality, and return exposure. Refresh time-sensitive fields before checkout.
The best Amazon online arbitrage scanner does not chase every spread. It proves that demand is category-relevant, price is durable, competition is manageable, and profit survives a worse scenario. Use Easyparser to refresh the marketplace evidence, then keep identity, compliance, and purchasing authority with a human. That turns amazon online arbitrage data into repeatable sourcing discipline.
Start optimizing your Amazon strategy today
Start Your Free Trial100 free credits, no credit card required.