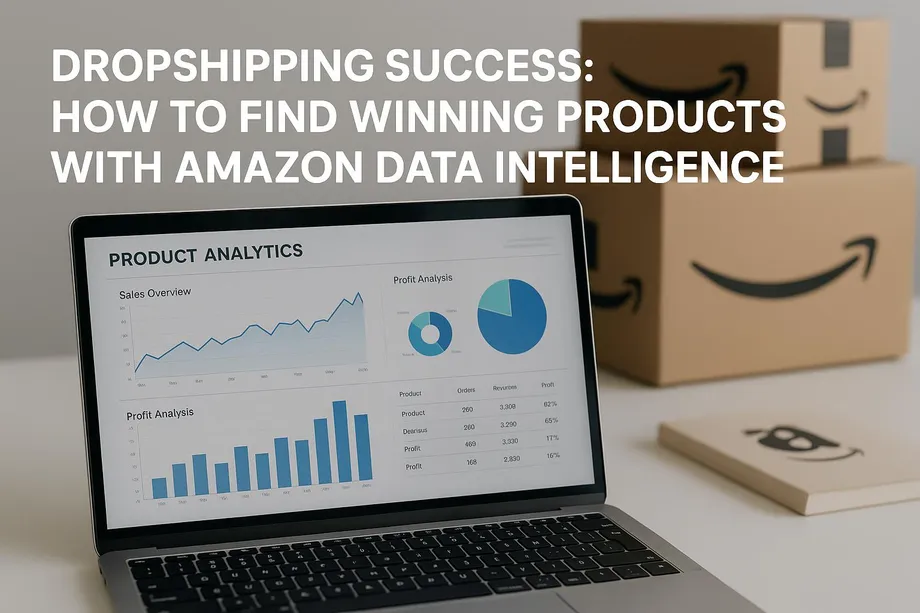
Launching a successful private label brand on Amazon starts with finding the right product. In a marketplace with millions of listings and fierce competition, relying on gut feeling can be a costly mistake. The key to sustainable success in 2026 is adopting a systematic, private label product research methodology grounded in real data. With Amazon's sales revenue projected to reach $700 billion by end of 2026, the opportunity for sellers who identify the right products is enormous.
This guide details a 4-step, repeatable method using the Easyparser API to uncover profitable product opportunities. Its key advantage is access to unique data sources like Sales Analysis & History and Package Dimension that traditional web scrapers simply cannot provide. While competitors only scrape visible page data, Easyparser accesses Amazon's internal data channels to deliver actual sales history, traffic analytics, and logistics data - all crucial for effective private label product research.
The Foundation of Success: Data-Driven Private Label Product Research
Being a successful Amazon seller requires more than just finding a popular product. Real success comes from identifying products that offer stable demand, manageable competition, and healthy profit margins simultaneously. Building a product profile that meets all three criteria is vital, especially for sellers just starting out.
| Criterion | Description | Ideal Values |
|---|---|---|
| Demand | How frequently the product is searched for and purchased. Stable demand means sustainable revenue regardless of seasonal fluctuations. | At least 200-300 monthly sales, stable BSR, rising or flat traffic trend. |
| Competition | The strength and number of other sellers in the niche. Low competition indicates a lower barrier to entry. | Average reviews under 150 on page one, no dominant big brands, reasonable total seller count. |
| Profitability | Net profit remaining after all costs (product cost, FBA fee, referral fee, PPC, shipping) are deducted. | Net profit margin above 20%, $30-$70 price range, under 2 lbs weight for lower FBA fees. |
Manually analyzing these criteria across hundreds of products is nearly impossible. This is where APIs with direct access to Amazon's data channels become essential. Let's explore the 4-step method that automates and deepens this analysis.
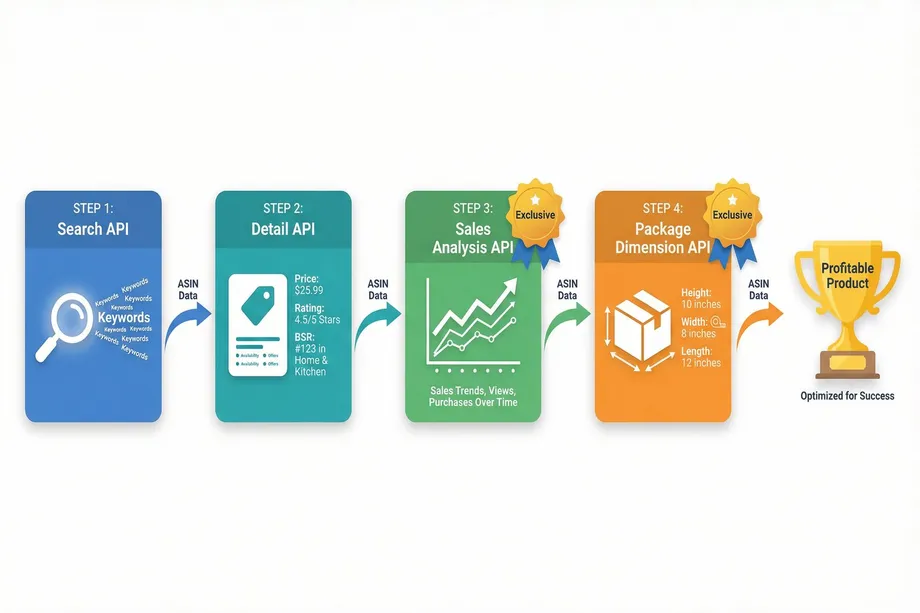
The 4-Step API Chaining Method: Overview
This method runs four different APIs sequentially (chaining), creating a pipeline that enriches data at each step. ASIN data obtained at each stage is passed to the next, ultimately producing a comprehensive dataset that allows you to fully evaluate a product's profitability.
Step 1: Category Analysis and Product Discovery (Search API)
Every product research process begins with a broad market scan. The goal is to identify niches with potential and the initial product candidates within them. At this stage, you start with a general keyword such as "bamboo kitchen organizer" or "silicone baking mat."
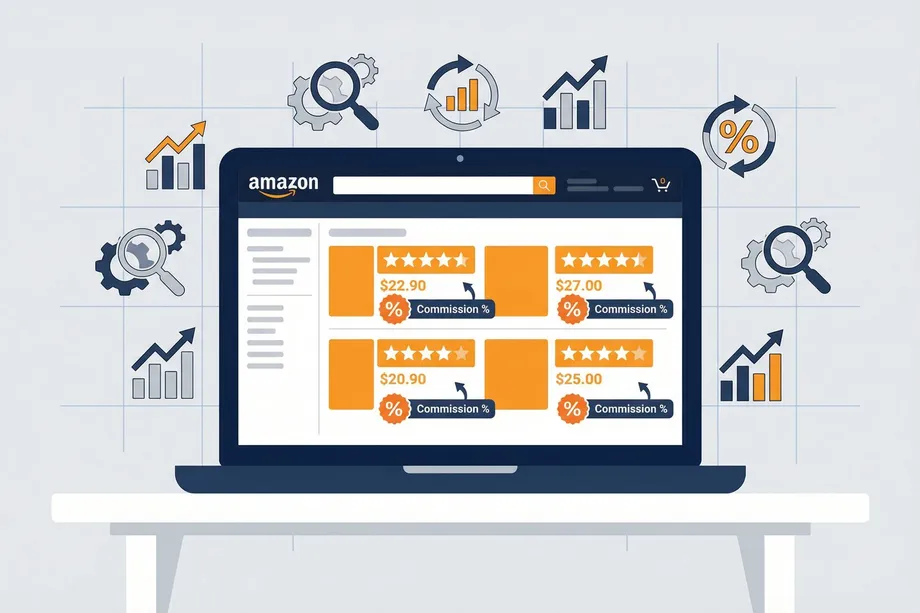
Easyparser's Search API scans Amazon's search results for your keyword and returns a list including each product's ASIN, title, price, rating, review count, and brand. The refinements data also reveals related brands, price ranges, and subcategories. For sellers, focus on products in the $30-$70 range with fewer than 150 reviews on page one. For buyers, look for niches where low-rated products dominate, signaling an opportunity for a better alternative.
Python Example: Discovering Products with Search API
import requests
import json
API_KEY = "YOUR_API_KEY" # Get your key from app.easyparser.com
KEYWORD = "bamboo kitchen organizer"
params = {
"api_key": API_KEY,
"platform": "AMZ",
"operation": "SEARCH",
"domain": ".com",
"keyword": KEYWORD
}
response = requests.get("https://realtime.easyparser.com/v1/request", params=params)
data = response.json()
# Filter: $30-$70 price range, under 150 reviews
candidates = []
for product in data.get("result", {}).get("search_results", []):
price = product.get("price", {}).get("value", 0)
reviews = product.get("total_reviews", 0)
if 30 <= price <= 70 and reviews < 150:
candidates.append(product)
print(f"ASIN: {product['asin']}, Price: ${price}, Reviews: {reviews}")
Step 2: Product Details and Competition Analysis (Detail API)
Using ASINs from Step 1, you call Easyparser's Detail API - the second link in the chain. This API returns critical listing data in a structured format, including Best Sellers Rank (BSR), bundle status (is_bundle), similar products (similar_to_consider), and recent purchase activity (bought_activity).
BSR shows a product's sales performance within its category - lower BSR means higher sales volume. The bestsellers_rank_flat data lets you see rankings across multiple categories to understand niche depth. For sellers, this reveals competition strength. For buyers, high BSR but low ratings indicate consumer dissatisfaction - a perfect opportunity for a better alternative.
Step 3: Real Demand and Trend Analysis (Sales Analysis & History API)
This is where Easyparser definitively separates itself from traditional web scrapers and gives you a real competitive edge. Services like Oxylabs essentially act as proxies, scraping visible data from Amazon pages. The Sales Analysis & History API, however, accesses Amazon's internal data channels to reveal a product's performance history and hidden metrics that no competitor can offer. This is the most critical step in your private label product research process.
Unique Data Points from This API
| Data Point | API Field | Strategic Value |
|---|---|---|
| Traffic & Conversion Rate | total_views, purchases_last_30_days | Calculate real conversion rates. High traffic but low sales signals an opportunity for a better product. |
| Weekly Sales History | history[].purchases, history[].views | Analyze up to 12 months of weekly sales and traffic data to measure seasonality and demand stability. |
| Price History | history[].average_price | Identify price wars and price stability. Continuously dropping prices signal profitability risk. |
| FBA & Referral Fees | fba_fee_last_360_days, referral_fee_last_360_days | Use actual Amazon fees for accurate profitability calculations instead of estimates. |
| Launch Date & Product Age | launch_date, age | Understand how long competitors have been in the market and whether their success is sustainable. |
For sellers, analyzing weekly purchases and views enables demand forecasting - determine whether demand is rising, falling, or stable. The month_over_month_change metric shows monthly growth rate directly. For buyers, the relationship between total_views and purchases_last_30_days is key - high views but low sales means consumers are searching but not satisfied.
Python Example: Trend Analysis with Sales Analysis API
# Analyze candidates from Step 2 with Sales Analysis API
for candidate in candidates:
asin = candidate.get("asin")
sales_params = {
"api_key": API_KEY,
"platform": "AMZ",
"operation": "SALES_ANALYSIS_HISTORY",
"asin": asin,
"domain": ".com",
"history_range": "12"
}
result = requests.get("https://realtime.easyparser.com/v1/request", params=sales_params).json()
product = result.get("result", {}).get("product", {})
perf = product.get("performance", {})
monthly_sales = perf.get("sales", {}).get("purchases_last_30_days", 0)
monthly_views = perf.get("traffic", {}).get("views_last_30_days", 0)
conversion = (monthly_sales / monthly_views * 100) if monthly_views > 0 else 0
fees = product.get("pricing", {}).get("fees", {})
print(f"ASIN: {asin}, Sales: {monthly_sales}, Conv: {conversion:.2f}%")
print(f" FBA Fee: ${fees.get('fba_fee_last_360_days', 0):.2f}")
Step 4: Profitability and Logistics Analysis (Package Dimension API)
How much a product sells matters, but how much profit it leaves you matters equally. Amazon FBA fees vary significantly based on dimensions and weight. According to 2026 FBA fee updates, standard-size items saw an average $0.08 per unit increase, while large items above $50 saw increases up to $0.31 per unit.
Easyparser's Package Dimension API provides verified package dimensions (height, width, length) and weight - the exact data Amazon uses to calculate FBA fees. This is data that competitors like Oxylabs do not offer. For sellers, a small packaging optimization can move a product from "Large Standard" to "Small Standard" tier, saving $2-5 per unit. For buyers, these dimensions enable realistic cost calculations before committing capital.
Profitability Calculator
By combining data from all four APIs, you can build your own profitability calculator:
| Cost Item | Source | Description |
|---|---|---|
| Selling Price | Detail API / Sales Analysis API | Current or average selling price of the product. |
| Product Cost (COGS) | Supplier | Per-unit manufacturing or purchase cost. |
| FBA Fee | Sales Analysis API | Amazon's fulfillment fee, varies by size and weight. |
| Referral Fee | Sales Analysis API | 8-15% of selling price, varies by category. |
| Shipping Cost | Package Dimension API | Cost to ship from supplier to Amazon warehouse. |
| PPC Cost | Estimate | Advertising spend, typically 10-15% of selling price. |
Net Profit = Selling Price - COGS - FBA Fee - Referral Fee - Shipping - PPC
Profit Margin (%) = (Net Profit / Selling Price) x 100
Python Example: Full API Chaining and Profitability Calculation
def analyze_profitability(asin, product_cost, ppc_pct=0.12):
# Step 3: Sales Analysis API - sales data and fees
sales_params = {
"api_key": API_KEY, "platform": "AMZ",
"operation": "SALES_ANALYSIS_HISTORY",
"asin": asin, "domain": ".com"
}
sales = requests.get(BASE_URL, params=sales_params).json()
product = sales.get("result", {}).get("product", {})
price = product.get("pricing", {}).get("average_price_last_90_days", 0)
fba = product.get("pricing", {}).get("fees", {}).get("fba_fee_last_360_days", 0)
referral = product.get("pricing", {}).get("fees", {}).get("referral_fee_last_360_days", 0)
# Step 4: Package Dimension API - logistics
dim_params = {
"api_key": API_KEY, "platform": "AMZ",
"operation": "PACKAGE_DIMENSION",
"asin": asin, "domain": ".com"
}
dim = requests.get(BASE_URL, params=dim_params).json()
weight = dim.get("result", {}).get("package", {}).get("weight", {}).get("value", 0)
shipping = weight * 0.50
ppc = price * ppc_pct
net = price - product_cost - fba - referral - ppc - shipping
margin = (net / price * 100) if price > 0 else 0
return {"asin": asin, "price": price, "net_profit": net, "margin": margin}
Start Making Data-Driven Product Decisions Today
Stop guessing and start analyzing. Get access to sales history, traffic data, and logistics intelligence that competitors simply cannot provide. Try the Easyparser API suite and discover profitable private label opportunities with confidence.
Traditional Scrapers vs. Easyparser: Why the Difference Matters
Many Amazon data tools (Oxylabs, ScraperAPI, etc.) operate as proxy services that scrape visible HTML data. While this works for basic information, it falls short of the depth required for serious private label product research.
| Feature | Traditional Scrapers (Oxylabs, etc.) | Easyparser |
|---|---|---|
| Product search and basic info | Available | Available |
| Price and review data | Available (current) | Available (current + historical) |
| BSR data | Available (current) | Available (current + historical trend) |
| Actual sales counts (purchases) | Not available | Available (30/90/360 days) |
| Traffic data (views) | Not available | Available (total + monthly) |
| Weekly historical data (up to 12 months) | Not available | Available (price, BSR, sales, reviews) |
| FBA and Referral fees | Not available | Available |
| Package dimensions and weight | Not available | Available (verified data) |
Conclusion: Data is Your Greatest Asset in Private Label
Building a successful private label business on Amazon does not happen by chance. It is a strategic process that requires meticulous analysis of market demand, competition, and profitability using the right data. The 4-step private label product research method presented in this guide offers a comprehensive pipeline - from broad market scanning with Search API, to competition analysis with Detail API, to real demand and trend analysis with Sales Analysis & History API, and finally to profitability calculation with Package Dimension API.
The greatest strength of this method lies in the unique APIs used in Steps 3 and 4. Real sales data, traffic analytics, historical trends, and verified logistics data that traditional scraper tools cannot provide allow you to base your investment decisions on solid ground. By adopting this data-driven approach, you can make smarter product selections, minimize risk, and stop leaving your Amazon success to chance.
Start scaling your e-commerce business today
Start Your Free Trial100 free credits, no credit card required.