For Amazon FBA entrepreneurs, the excitement of finding a new product idea often overshadows the rigorous validation required to ensure its success. Many sellers rely on snapshot metrics - a single day's Best Sellers Rank (BSR) or a quick glance at search volume - to make decisions that will cost them thousands of dollars in inventory and marketing. This approach is fundamentally flawed. A product that looks like a winner today might be at the end of its lifecycle, suffering from high return rates, or facing a brutal price war.
To truly validate amazon product idea viability, you must transition from intuition-based sourcing to a comprehensive, data-driven strategy. This involves analyzing historical trends, understanding competitor behavior over time, and evaluating the underlying economics of the market. In this guide, we will walk through a structured, four-step framework to validate your Amazon product idea using real data, ensuring you only commit capital to opportunities with a high probability of profitable growth.
The framework presented here is designed for FBA entrepreneurs who want to treat product research as a scientific process, not a guessing game. Every step includes concrete data signals you can extract using the Easyparser API, transforming raw Amazon data into actionable launch decisions.
Why Validation Matters: The Cost of Launching Without Data
The Amazon marketplace is more competitive than ever. The days of launching a generic product, running a few auto-campaigns, and ranking on page one are long gone. Today, a successful launch requires a deep understanding of market dynamics. Launching without proper validation exposes you to several critical risks that can destroy your investment before you even start generating revenue.
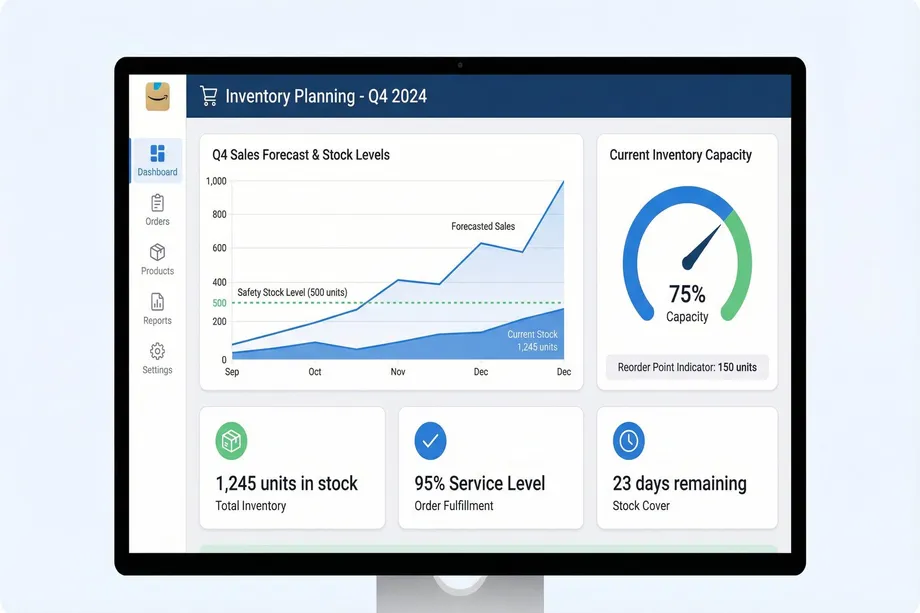
- Inventory Capital Traps: Ordering 1,000 units of a product in a declining market means your capital is tied up in slow-moving stock, incurring long-term storage fees that erode your margins month after month.
- Margin Erosion: Entering a niche where competitors are aggressively cutting prices will quickly destroy your profit margins, making customer acquisition unprofitable even with a well-optimized listing.
- High Return Rates: Failing to analyze structural product flaws before launch can result in return rates that wipe out any gross profit, regardless of how well the listing converts.
- Missed Seasonality Windows: Launching at the wrong time in a seasonal category means you will miss the peak demand window entirely, leaving you with excess inventory and no organic velocity to build on.
By implementing a robust validation process, you transform these risks into calculated decisions. You shift the question from "Is this a good product?" to "Is this a growing market where I can profitably capture market share?" This is the mindset shift that separates successful FBA sellers from those who burn through capital on failed launches.
Step 1: Validate Demand with BSR Trends
The Best Sellers Rank (BSR) is the most direct indicator of a product's sales velocity relative to its category. However, a snapshot BSR is deeply misleading. A product might have a great BSR today due to a Lightning Deal or an aggressive ad campaign, but its organic baseline might be terrible. To accurately validate amazon product idea demand, you must analyze BSR trends over a 6 to 12-month period.
This historical perspective reveals the true health of the product lifecycle. Are sales steadily increasing, highly seasonal, or slowly declining? By leveraging the Amazon Sales Analytics API, you can extract long-term BSR fluctuations and purchase activity to map out the exact demand trajectory of your target niche. The API's SALES_ANALYSIS_HISTORY operation returns up to 12 months of data, including average BSR per month, average price, and purchase counts.
When analyzing BSR trends, look for consistent performance with gradual improvement. A healthy product shows a BSR that stays within a predictable range and improves slightly over time, indicating organic demand rather than promotional spikes. Avoid markets where the top competitors show extreme volatility without clear seasonal reasons, as this often indicates unstable demand or heavy reliance on unsustainable discount strategies.
A practical benchmark: if the top 3 sellers in a category consistently maintain a BSR below 5,000 in their primary category over a 6-month period, the market has sufficient, stable demand to support a new entrant. If the BSR fluctuates wildly between 500 and 50,000, the demand is either highly seasonal or driven by external promotions rather than organic search traffic.
Step 2: Analyze Competitor Pricing and Offer Count
Demand is only half the equation when you attempt to validate amazon product idea viability. You must also evaluate the competitive landscape in detail. A growing market is useless if the dominant players are engaged in a race to the bottom, making it impossible for a new entrant to compete profitably.
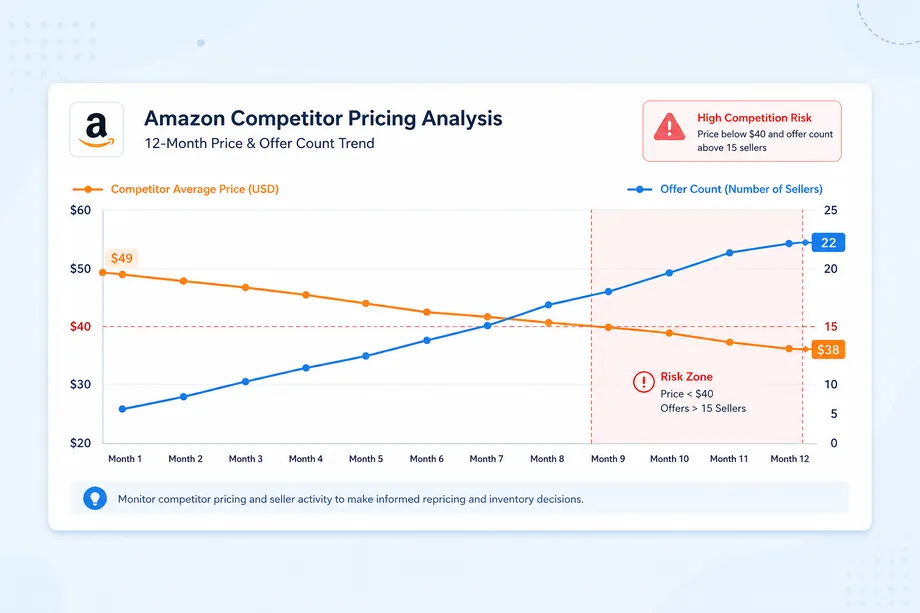
Historical pricing analysis is crucial. You need to know if the current average price is stable or if it has been steadily dropping over the past year. Furthermore, tracking the offer count - the number of active sellers on a listing - provides insight into market saturation and the presence of hijackers.
Using the Amazon Product Lookup API, you can resolve competitor ASINs and track their historical pricing and offer count changes. If you observe a market where the average price is dropping while the number of sellers is increasing, it is a strong signal to look elsewhere. Conversely, a market with stable premium pricing and a consistent offer count indicates a healthy environment for a differentiated product.
Pay particular attention to the relationship between price and offer count over time. A healthy market shows stable pricing with a moderate, consistent number of sellers. A dangerous market shows declining prices alongside an increasing number of sellers - the classic signature of a race to the bottom. When you see this pattern, even a superior product will struggle to maintain margins as competitors undercut each other to win the Buy Box.
Step 3: Study Sales History to Find Seasonal Patterns
Seasonality can make or break an Amazon launch. Launching a summer product in September will result in stagnant inventory and wasted ad spend. Before you can properly validate amazon product idea timing, you must understand the seasonal demand curve of your product category and plan your production timeline accordingly.
Historical sales data allows you to pinpoint exactly when demand spikes and when it drops. This information is vital for inventory forecasting and launch timing. You want your product to hit the Amazon fulfillment centers just as the demand curve begins its upward slope, allowing you to ride the wave of organic traffic and build review velocity during the peak season.
Here is an example of how you can programmatically retrieve historical sales data to analyze seasonality using Python and Easyparser:
import requests
API_KEY = "YOUR_API_KEY" # Get your key from app.easyparser.com
ASIN = "B08F2W5J3C"
params = {
"api_key": API_KEY,
"platform": "AMZ",
"operation": "SALES_ANALYSIS_HISTORY",
"domain": ".com",
"asin": ASIN,
"history_range": "12"
}
response = requests.get("https://realtime.easyparser.com/v1/request", params=params)
data = response.json()
history = data.get("historical_data", [])
for month in history:
print(f"Month: {month.get('date')} | BSR: {month.get('average_bsr')} | Avg Price: ${month.get('average_price')}")
By feeding this data into a spreadsheet or BI dashboard, you can visualize the exact months when demand peaks, ensuring your launch strategy is perfectly timed. For example, if the data shows that BSR consistently improves (lower number) between October and December for a kitchen gadget, you should plan to have your inventory at Amazon fulfillment centers by late September to capture the holiday demand surge.
Analyzing 3 to 5 competitor ASINs simultaneously gives you a reliable picture of the category's seasonal rhythm. If all top sellers show the same BSR improvement pattern in the same months, you have confirmed a genuine seasonal trend rather than a one-off promotional event from a single seller.
Step 4: Analyze Competitor Review Velocity and Sentiment
Reviews are the currency of Amazon. To successfully enter a market and validate amazon product idea competitiveness, you must understand not only how many reviews top competitors have, but how fast they are acquiring them (review velocity) and what customers are actually saying (review sentiment).
Review velocity indicates how entrenched a competitor is. If the top seller is acquiring 100 new reviews a month, and your launch budget only allows for generating 10 reviews a month, you will never catch up organically. You must either increase your budget significantly or find a less aggressively reviewed niche where you can build social proof at a competitive pace.
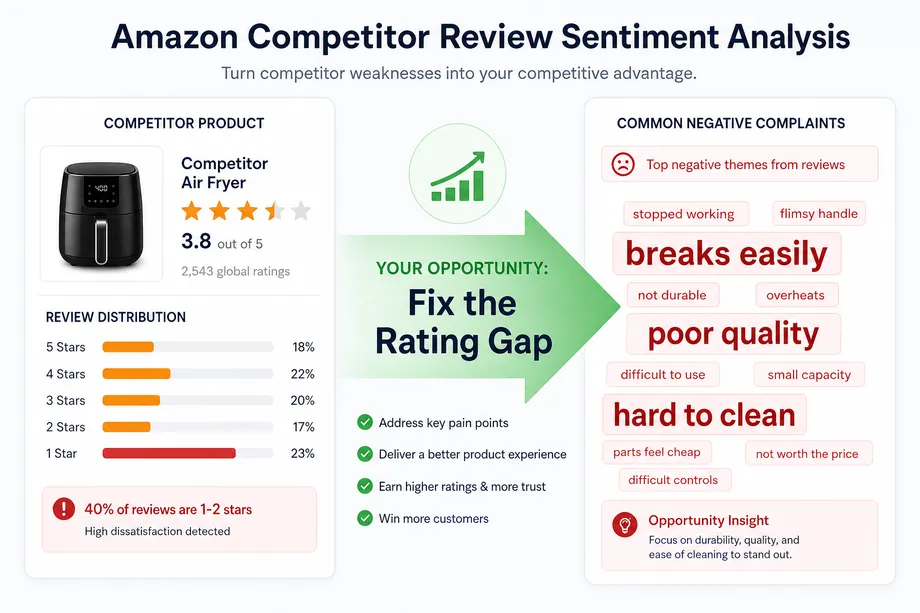
Equally important is sentiment analysis. By extracting and analyzing negative reviews using the Amazon Product Data API, you can identify the "Rating Gap." If all top competitors suffer from the same design flaw - such as a handle that breaks easily - you have found your differentiation strategy. You do not need to invent a new feature; you just need to fix the problem the market is already complaining about.
The Rating Gap Method works as follows. First, aggregate negative reviews across the top 5 competitors in your target market. Look for patterns in 1-star and 2-star reviews. Second, identify the most common complaint themes. Third, assess whether these complaints are addressable through product design changes without dramatically increasing your manufacturing cost. If the gap is large and addressable, you have a clear, data-backed differentiation strategy. If the gap is small and ratings are already above 4.5 stars, the market is mature and you will need to compete on traffic execution rather than product innovation.
Building a Launch Readiness Scorecard
To remove emotion from the validation process, compile all your findings into a Launch Readiness Scorecard. This scorecard should have strict kill criteria. If a product idea fails to meet the minimum thresholds, you kill the idea and move on without hesitation. The scorecard is the mechanism that prevents you from falling in love with a product idea and ignoring the data signals telling you to walk away.
A robust scorecard for any seller who wants to validate amazon product idea potential should include the following dimensions:
- Market Size: Is the total addressable revenue sufficient? A minimum threshold of $2M per year in category revenue ensures there is enough demand to build a sustainable business even if you capture a modest market share.
- Growth Trend: Is the category growing year-over-year based on historical BSR data? A large but shrinking market is worse than a smaller but growing one.
- Margin Potential: Does the historical average price support a healthy gross margin after FBA fees, landed costs, and advertising spend? A stable price history above your minimum viable price point is a green light.
- Differentiation Opportunity: Is there a clear, data-backed rating gap you can exploit through product improvements? If all competitors are already at 4.8 stars, differentiation becomes significantly harder.
- Traffic Viability: Can you profitably acquire customers given the competitor review velocity and estimated CPCs? If the top sellers have 10,000+ reviews and are spending heavily on ads, the cost of customer acquisition may make the market unprofitable for a new entrant.
- Seasonal Alignment: Does your production and shipping timeline align with the peak demand season identified in the sales history data?
Only when a product idea scores positively across all these dimensions should you proceed to the next phase: a small-batch test order of 200 to 300 units to validate your assumptions in the real market before committing full capital.
Real Case: How One Seller Avoided a $50K Mistake
Consider the case of an FBA seller looking to launch a premium garlic press. The snapshot metrics looked incredible: high search volume, top sellers generating six figures a month, and a seemingly straightforward product to source from existing manufacturers.
However, when the seller applied the data-driven framework to validate amazon product idea viability, the story changed completely. Historical BSR analysis showed that while the top three sellers were stable, the rest of the market was highly volatile. More importantly, pricing history revealed a slow but steady decline over the past 12 months, indicating increasing saturation from new entrants driving prices down.
The final signal came from sentiment analysis. The negative reviews across all top products were not about the design, but about the inherent difficulty of cleaning the tool - a problem that could not be easily solved without completely redesigning the mechanism, which would drastically increase manufacturing costs and eliminate the margin advantage.
By using data to validate amazon product idea viability before ordering inventory, the seller recognized the structural flaws in the market and walked away. Instead of sinking $50,000 into a saturated, declining margin product, they pivoted to a different kitchen gadget with a clear rating gap and stable historical pricing, ultimately executing a highly profitable launch with a 40% gross margin in the first quarter.
This is the power of data-driven validation. It does not just tell you what to launch - it tells you what not to launch, protecting your capital and directing your energy toward opportunities with a genuine probability of success. Every seller who takes the time to validate amazon product idea viability with real data before committing to inventory is making a decision that separates professional operators from hopeful gamblers.
Start making data-driven decisions today
Start Your Free Trial100 free credits, no credit card required.