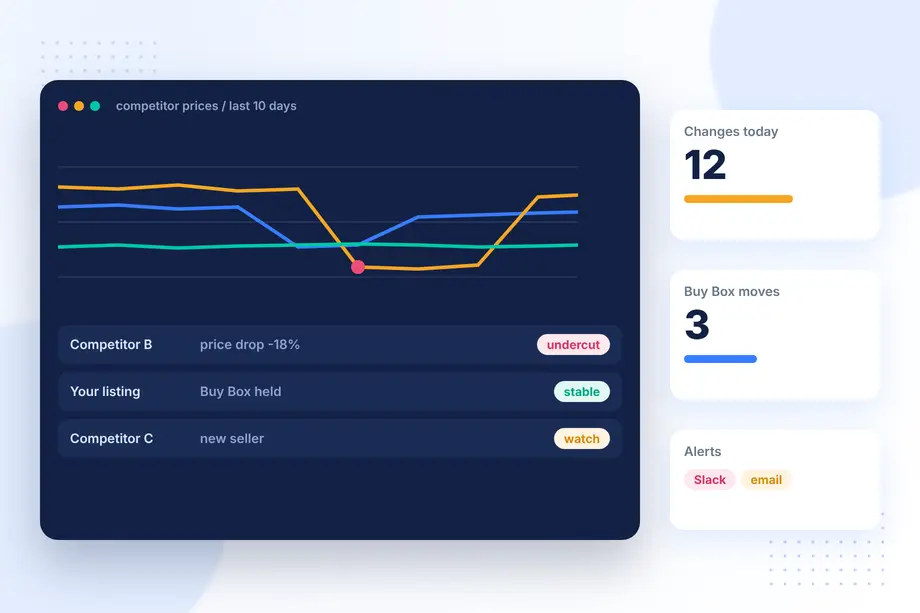
Competitor prices on Amazon move daily, sometimes hourly. Sellers who see a rival's price drop the same day can react before the Buy Box shifts; sellers who check once a week find out from their sales report. An amazon competitor price monitoring dashboard closes that gap by collecting prices on a schedule, storing every observation, flagging meaningful changes, and showing it all in one place.
This step-by-step guide builds a working dashboard: architecture, collection with Easyparser, storage, change detection, a Streamlit interface, alerts, a no-code option, and how to scale to thousands of products.
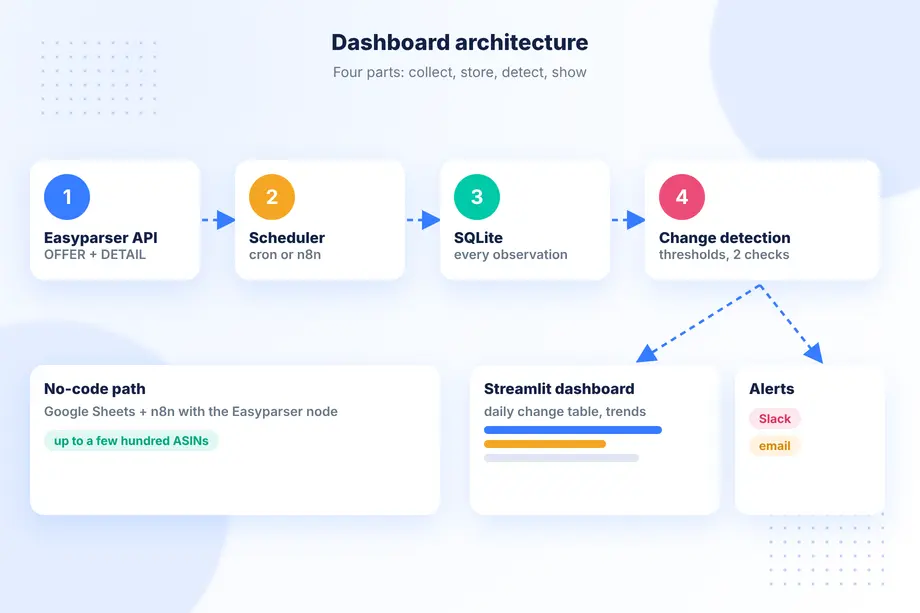
Dashboard Architecture: Components and Data Flow
| Component | Tool in this guide | Job |
|---|---|---|
| Watchlist | CSV of ASINs | Which products to track, and whose they are |
| Collector | Easyparser API + Python | Fetch current offers on a schedule |
| Storage | SQLite | Keep every observation with a timestamp |
| Detector | Python rules | Find price drops, new sellers, Buy Box changes |
| Dashboard | Streamlit | Charts and tables for the team |
| Alerts | Slack or email webhook | Push important changes |
Each component is small and replaceable. You can swap SQLite for PostgreSQL or Streamlit for a BI tool without touching the rest.
Step 1: Setting Up Easyparser for Bulk Price Fetching
Create a watchlist file with one row per ASIN: the ASIN, marketplace, whether it is your product or a competitor's, and a label. Then fetch offers. The Easyparser Product Offer API returns every visible seller with price, condition, fulfilment, and a Buy Box flag, which is exactly what price monitoring needs. If you only need the Buy Box price and product context, the Product Detail API returns it with the full listing.
import csv, sqlite3, requests
from datetime import datetime, timezone
API_KEY = "YOUR_API_KEY" # Get your key from app.easyparser.com
db = sqlite3.connect("prices.db")
db.execute("""CREATE TABLE IF NOT EXISTS offers (
captured_at TEXT, asin TEXT, label TEXT, seller TEXT,
price REAL, currency TEXT, buybox INTEGER, fba INTEGER)""")
def collect(asin, label, domain=".com"):
params = {"api_key": API_KEY, "platform": "AMZ", "operation": "OFFER",
"domain": domain, "asin": asin, "condition_new": True}
res = requests.get("https://realtime.easyparser.com/v1/request", params=params, timeout=60).json()
ts = datetime.now(timezone.utc).isoformat(timespec="minutes")
for o in res["result"]["offer"]["offer_results"]:
db.execute("INSERT INTO offers VALUES (?,?,?,?,?,?,?,?)", (
ts, asin, label, o["seller"]["name"],
float(o["price"]["value"]), o["price"]["currency"],
int(o.get("buybox_winner", False)),
int(o["delivery"].get("fulfilled_by_amazon", False))))
db.commit()
with open("watchlist.csv") as f:
for row in csv.DictReader(f):
collect(row["asin"], row["label"])
Run the script from cron, a GitHub Action, or any scheduler. Twice a day is enough for most categories; hourly makes sense for fast-moving electronics or during sales events.
Step 2: Storing Price Data in a Database
The table above stores one row per seller offer per capture. That shape lets you answer every common question: the lowest price per ASIN over time, who held the Buy Box, how many sellers competed, and how often prices changed. Add an index on (asin, captured_at) once the table grows.
Never overwrite rows. Price monitoring is history, and the value of the dashboard grows with every capture you keep.
Step 3: Detecting Price Changes and Anomalies
Compare each new capture with the previous one for the same ASIN and flag:
- Buy Box price change above a threshold, for example 5 percent.
- Buy Box owner change, especially from your account to a competitor.
- New seller on a listing you sell.
- Price below your floor on a competitor ASIN you benchmark against.
- Anomalies such as a price of zero, a currency mismatch, or a missing offer list, which are data issues to review rather than market signals.
Require a change to persist across two captures before alerting, unless it is a Buy Box loss. Short-lived price blips are common and generate noise.
Step 4: Building the Dashboard with Streamlit
Streamlit turns a Python script into a web page. A minimal version shows a product selector, a price history chart, and a table of the latest offers.
import sqlite3, pandas as pd, streamlit as st
df = pd.read_sql("SELECT * FROM offers", sqlite3.connect("prices.db"), parse_dates=["captured_at"])
st.title("Competitor price monitor")
label = st.selectbox("Product", sorted(df["label"].unique()))
view = df[df["label"] == label]
buybox = view[view["buybox"] == 1].set_index("captured_at")["price"]
lowest = view.groupby("captured_at")["price"].min()
st.line_chart(pd.DataFrame({"Buy Box": buybox, "Lowest offer": lowest}))
latest = view[view["captured_at"] == view["captured_at"].max()]
st.dataframe(latest[["seller", "price", "buybox", "fba"]].sort_values("price"))
Run it with streamlit run dashboard.py. Add a second page that lists all flags from Step 3, newest first, and the team has a daily view in a few minutes of work.
Step 5: Setting Up Automated Alerts
Dashboards are pulled; alerts are pushed. Post Step 3 flags to a Slack channel or email with a short message: product label, old and new price, seller, and a link to the dashboard page. Group alerts per run so the team receives one message, not twenty. Keep a mute list for ASINs that change price constantly, and review it monthly.
No-Code Alternative: Google Sheets + n8n
Not every team wants to maintain Python. With n8n and the Easyparser node, a workflow can read ASINs from a Google Sheet, fetch offers on a schedule, append rows to a "history" tab, compare with the previous row, and send a Slack message when a rule fires. Google Sheets charts then act as the dashboard. This setup works well up to a few hundred ASINs. Our n8n competitor monitoring guide walks through a similar workflow node by node.
Scaling to 10,000 Products
At a few thousand ASINs, three things change. First, switch collection to the Easyparser Bulk API: submit all ASINs in one job and receive results by webhook instead of looping. Second, move storage to PostgreSQL or a cloud warehouse and partition by date. Third, prioritise: track your top sellers and closest competitors several times a day, and the long tail daily or weekly. Credits follow requests, so a tiered schedule keeps costs predictable while the important listings stay fresh.
Whatever the size, keep the same principles: store every observation, alert only on persistent or critical changes, and treat strange values as data issues first.
Common Mistakes When Building a Price Dashboard
An amazon competitor price monitoring dashboard is only as useful as the data and rules behind it. These mistakes are the most common in first versions:
- Storing only the latest price. Without history you cannot see trends or tell a one-day dip from a lasting change. Append every observation with a timestamp.
- Comparing different offers. The Buy Box price, the lowest new offer and a used offer are different numbers. Store the offer type and compare like with like.
- Alerting on every change. Prices on busy listings move several times a day. Use thresholds and require a change to persist across two checks before alerting.
- Ignoring missing values. A missing price often means no Buy Box or an out-of-stock listing, not a price of zero. Show it as a status, not a number.
- Building charts nobody opens. Start with one table of the biggest changes since yesterday. Add charts once people use the table.
Who Uses the Dashboard and How
Different roles read the same data differently. Pricing managers look at the daily change table and decide whether to react. Category managers look at weekly trends across a brand or segment. Leadership usually wants a short summary: how many tracked products changed price, how often competitors undercut you, and where the Buy Box moved. Design your amazon competitor price monitoring dashboard with one page per audience rather than one crowded page for everyone, and agree on who owns each alert so changes lead to decisions instead of a growing inbox.
Choosing Which Products and Metrics to Track
Before adding more ASINs, decide what the dashboard is for. A reseller cares about the Buy Box price and who holds it. A brand cares about unauthorised sellers and minimum advertised price breaches. A category manager cares about the price position of a whole segment. Each goal implies a different product list and a different headline metric, so write the goal at the top of the dashboard and let it drive what you collect.
A practical starting set is your top products by revenue, plus the two or three direct competitors shown most often next to each one. Track for each: Buy Box price, Buy Box seller, number of new offers, lowest new offer price, and stock or availability text. Add rating and review count weekly rather than daily, because they change slowly. This keeps request volume small while covering the questions most pricing teams ask first, and it gives you a clean base to extend later with rank or sales history data.
Review the list monthly. Remove products you no longer sell, add new competitor listings that appear in search, and archive their history instead of deleting it.
Keep a small data dictionary next to the dashboard as well, so every viewer knows which price each column shows and when it was captured.
Conclusion
An amazon competitor price monitoring dashboard does not need a large platform. A watchlist, scheduled offer collection with Easyparser, a database that keeps history, a few detection rules, and a Streamlit page or a Google Sheet cover the needs of most sellers. Start with your top 50 ASINs, tune the alert rules for a couple of weeks, and then scale with the Bulk API. The result is a monitoring setup your team actually uses, built on clean, structured price data.
Sources
- Offer response reference, Easyparser Documentation (accessed )
- Product Detail response reference, Easyparser Documentation (accessed )
- Bulk API overview, Easyparser Documentation (accessed )
- n8n integration, Easyparser Documentation (accessed )
Start analyzing Amazon data for free
Start Your Free Trial100 free credits, no credit card required.